Download
1 / 41
410 likes | 775 Vues
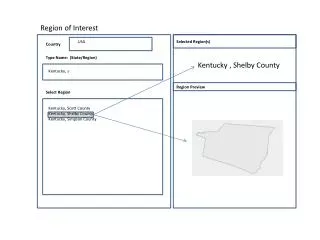
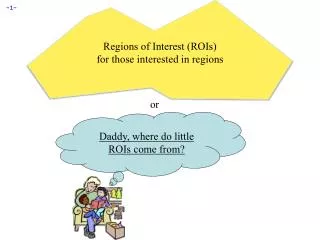
Regions of Interest ( ROIs ) for those interested in regions. or. Daddy, where do little ROIs come from?. What is an ROI?. An ROI is a "region of interest" usually used as a mask of voxels

E N D
Regions of Interest (ROIs)for those interested in regions or Daddy, where do little ROIs come from?
What is an ROI? • An ROI is a "region of interest" usually used as a mask of voxels • In AFNI, ROIs are stored as any other dataset (.HEAD/.BRIK, .nii, ...) , typically with positive integer values for voxels to consider. • Zero values are outside the mask. • Positive values are inside the mask • Note any dataset can be considered as an ROI if it is non-zero in areas in which you are interested. • Usually stored as byte integers to save disk space and memory Voxel with value of 1 Voxel with value of 0
Region of Interest Drawing and Usage in AFNI • Method 1: Draw it.Manually select Regions of Interest (ROIs) based on anatomical structures, then analyze functional datasets within these regions • E.g., Someone doing a study on emotion may want to draw an ROI mask that includes the amygdala only, in order to analyze the voxels that fall within that brain region • This method relies on ‘a priori’ assumptions about localization of brain function • Method 2: Cluster it.Analyze functional dataset for entire brain first, then focus on geometrically connected clusters of ‘activity’ (supra-thresholdvoxels in some functional statistical map) • i.e., analyze the entire brain first and then pinpoint interesting areas of activity and do further analyses on those areas (programs 3dclust and 3dmerge, or the AFNI graphical interface button [Clusterize], can assist you in finding those larger “blobs” or clusters of activity) • Even with this method, you might want to manually adjust the ROIs (i.e., add or delete some voxels in the ROI mask) • Method 3: Atlas it. Use atlases to select your ROIs regions • By using the whereami program or symbolic notation to create masks on the command line
Method 1- Handmade ROI’s from Anatomical Volumes • Quick outline of procedure: • On the main AFNI control panel, set the anatomical underlay dataset (with [UnderLay]) to be what you want to draw on -- usually a SPGR or MP-RAGE type of dataset • i.e., the anatomical underlay will serve as our guide or template for drawing the ROI mask • Start the Draw Dataset plugin (this is our ROI-creating plugin): • [Define Datamode][Plugins] [Draw Dataset] • Create an all zero anatomical overlay dataset with the Draw Dataset plugin. This is the beginning of our ROI mask. At this point, the anatomical overlay is empty - i.e., all the voxel values are zero • This anatomical overlay must have the same geometry as the anatomical underlay, i.e., it has the same voxel size as the underlay, the same xyz-grid spacing, etc…, since drawing/editing is done on a voxel-by-voxel basis • Think of the anat overlay as a blank piece of tracing paper that is the same size as the template underneath. The blank overlay will be used to trace portions of the underlay. Voxels inside the traced portion will make up the ROI mask. Values outside the traced region are irrelevant (zeros) • Note: You could also edit an already-existing ROI mask (that you created earlier) at this step
To view and begin drawing an ROI mask (or several ROIs) on this blank anatomical overlay dataset, go to the main AFNI interface and [Switch Overlay] to be the empty anatomical dataset you will be editing. Also turn the overlay ON with [See OverLay] • Start drawing the ROI mask into this blank anatomical overlay dataset. Voxels inside the ROI mask will receive a non-zero value (you decide what value to give them). Values outside the ROI mask will remain zero • Be sure to save the results by pressing [Save], [SaveAs] or [DONE] in the ROI plugin GUI ([Quit] will exit the ROI plugin without saving your work) • Convert the anatomical-resolution ROI dataset into a dataset at the resolution of the functional (statistical) datasets you want to analyze with the ROI • Note: The ROI and functional datasets may already be at the same resolution, if you are operating in +tlrc coordinates • Resolution conversion of masks is done with program 3dfractionize • Use programs 3dmaskave, 3dmaskdump, and 3dROIstats to extract ROI-based information about functional datasets • Also can use the ROI Averageplugin to extract interactively the average of a dataset over a ROI (does the same thing as 3dmaskave)
Using the Drawing Plugin Copy data, or fill with zero Data being edited now How to copy dataset when “Copy” button is active: Edit copy of dataset? • Critical things to remember: • You should have [See OverLay] turned on, and be viewing the same overlay dataset in AFNI as you are editing • Otherwise, you won’t see anything when you edit! • When drawing, you are putting numbers into a dataset brick • These numbers are written to disk only when you do [Save], [SaveAs] or [Done]; before then, you can [Quit] (or exit AFNI) to get the unedited dataset back Edit new dataset Value given to ROI voxels Edit in Overlay/ Underlay Color to display while drawing How to draw into dataset voxels: Fill between drawing planes Choose Atlas Region Actually load TT Atlas Region Save edits & continue editing Save edits into new dataset Done = Save & Quit Undo or Redo edits Exit without saving edits Keys 'o' and 'u' and scroll wheel come in handy here
Step 1: Load a dataset to be edited (for ROI creation): • [Choose Dataset] button gives you a list of datasets that (a) Actually have brick data with only one sub-brick; (b) Are at the same voxel dimension, grid size, etc., as current anatomical underlay • When you are starting, you probably don’t want to edit an existing dataset -- i.e., you don’t want to write on the underlay itself; you just want to use it as a template and draw on a blank overlay that shares the same geometry as that existing underlay dataset • To do this, you must create an all-zero copy of the anatomical underlay (by “copy” we mean the all-zero dataset shares the same geometry as the underlay, but not the same voxel data values) • To create an all-zero copy, click the [Copy] button on (from the Draw Datasetplugin GUI) and set the controls to its right to [Zero] [Show as Olay] and [As Is] • [Data] would make a copy of the underlay dataset with the actual voxel data values. [Zero] copies the geometry of underlay, but gives each voxel a data value of zero (this latter option is usually what you want when starting out)
[As Is] keeps the voxel values in the copy as the same type as in the original underlay; you can also change the voxel values to be stored as: • [Byte] (integer values: 0..255) 1 byte each • [Short] (integer values: -32767…32767) 2 bytes each • [Float] (fractional values) 4 bytes each • Bytes and Shorts make the most sense for ROI masks, where you are essentially attaching labels to voxels • Click on [Choose Dataset], select the dataset you want a copy of (e.g., the anatomical underlay), and then press [Set] • Step 2: Drawing the ROI (or ROIs): • Choose the value to draw into the anatomical overlay dataset (recall that all values in the copied/blank overlay dataset are zero at this point) • If you drawing only one ROI, then the default value of 1 is good • If you are drawing multiple ROIs, then you should choose a different numerical value for each so that they can be distinguished later • Pencil and paper are our friends -- write down which number corresponds with which ROI for later recall! • You could use ROI color maps (this is now the default): • Choose the '**' map. Set 'pos' on. • Right click on colormap --> Choose Colorscale --> ROI_i256 (or ROI_innn), • Set 'autoRange' off. Set range to 256 • Choose the drawing color • This is the color that is shown while you are drawing • Color choice is only important to give a good contrast with underlay, so don’t obsess too much over this
After you finish a drawing motion, the voxels you drew will be filled with the drawing value, the image will be redisplayed, and the colors will be determined by the [Define OverLay] control panel • Choose the drawing mode • [Filled Curve] Drawing action produces a continuous closed-ended curve (default setting) • [Open Curve] Drawing action produces a continuous open-ended curve • [Closed Curve] Drawing action produces a continuous closed-ended curce • [Points] Only points actually drawn over are filled (used to “touch up” and ROI) [Closed Curve] [Points] [Open Curve] [Filled Curve]
[FloodValue] Flood fills space outward from the drawing point, stopping when the flood hits the current drawing value (used to fill a closed curve) • [Flood Nonzero] Drawing action produces a continuous closed-ended curve (filled inside) • [ZeroValue] Floods voxels with zero until the flood hits nonzero voxels (you can also do this more easily with Filled Curve, value=0) • [FloodNonzero] Flood fills outwards from drawn point, stopping when the flood hits any nonzero voxel (used to fill between regions): • Important Note: • A ROI is defined by the values stored in voxels of the ‘mask’ dataset • Contiguity of voxels has no meaning to the ROI software described below • Two voxels are in the same ROI if they have the same value in the mask dataset (i.e., it doesn’t matter where they are located in the volume)
Actually draw something • Drawing is done with mouse Button 2 (“middle” button) in 2D slice image • Hold the button down in the image window during a single drawing action • While the drawing action is happening, the chosen drawing color will trace the screen pixels you draw over • When you release the button, these pixels are converted to voxels, and the dataset is actually changed, using the drawing value and drawing mode you selected • At this point, the color of the drawn region will change to reflect the drawing value and the setup of the [Define OverLay] control panel • [Undo] button will let you take back the last drawing action (you can go “undo” many levels back, i.e., multiple undo function) • You can draw on one 2D slice image at a time • If you draw on a montage display, only screen pixels overlaying the first image you Button 2 click in will count • While drawing, if you cross over between sub-images in the montage, unexpected effects will result • But there is always [Undo] to the rescue!
Step 3: Save your results: • [Save] will write the current dataset values to disk (overwriting any existing .BRIK file, i.e., if you had edited this ROI earlier, the new changes would overwrite the old file) • You could also then choose another dataset to edit • [Save As] will let you write the current dataset to disk under a new name, creating a new dataset, then continue editing the new dataset • [Quit] exits editing and closes the plugin window, without saving to disk any changes since the last [Save] • Exiting AFNI has the same effect • [Done] is equivalent to [Save] then [Quit] • Optional Drawing Steps: • [Linear Fillin] lets you draw a 3D ROI not in every slice, but in every third slice (say), and then go back and fill in the gaps • For example, if you draw in coronal slices, then you want to fill in the [A-P] direction (the default) • If you draw every nth slice, then you want to set the Gap to n-1 • Line segments of voxels in the fillin direction that have a current drawing value at each end, and have no more than [Gap] zero voxels in between, will get their gap voxels filled with the drawing value • After you try this, you will probably have to touch up the dataset manually
This operation can also be done with program 3dRowFillin, which creates a new dataset • [TT Atlas Region to Load] lets you load regions from the Talairach Daemon database into the dataset voxels • Requires that you be drawing in +tlrc coordinates, or at least have a transformation from +orig +tlrc computed in the current directory • Choose a region to draw into the dataset (e.g., Hippocampus) • [Load: Overwrite] will fill all voxels in the region with the drawing value • [Load: Infill] will fill only voxels in the region that are currently zero • You probably want to edit the results manually to fit the specific subject • Drawing and Volume Rendering at the Same Time (totally fun, and maybe useful) • You cannot draw into the rendering plugin, but you can use it to see in 3D what you are drawing in 2D • If you meet the criteria for rendering (usually in +tlrc coordinates) • How to set up the renderer: • Choose the underlay to be the current anatomical dataset (or a “scalped” version, from 3dSkullStrip or 3dIntracranial) • Choose the overlay dataset to be the dataset you are editing • Turn on [See Overlay] • Set [Color Opacity] to [ShowThru] (or ST+Dcue)
Turn on [DynaDraw] • Drawing in a 2D image window immediately triggers a redraw in the rendering window (if the 2D and 3D overlay datasets are the same) • This is only useful if your computer is fast enough to render quickly (<1 sec per frame)
Things to Do with ROI Datasets (no matter how you create them) • ROIs are used on a voxel-by-voxel basis to select parts of datasets (usually functional datasets) • If you draw at the anatomical resolution and want to use the ROI dataset at the functional resolution, you probably want to convert the high-resolution ROI dataset to a low-resolution dataset (unless you’re working in +tlrc coordinates) • E.g., hi-res anatomical ROI resampled to low-res functional dataset: • Each voxel inside the ROI is given a nonzero value (e.g., 4; values outside the ROI are zeros. When the resolution is changed, what do you do with a voxel that’s only partially filled by the ROI? Hi-res voxel matrix Low-res voxel matrix
3dfractionize does this resolution conversion: 3dfractionize -template low_res_dset+orig \ -input ROI_high_res+orig \ -clip 0.5 -preserve -prefix ROI_low_res • -template The destination grid you want your ROI grid to be resampled to (we’re going from high to low resolution here). Our output dataset ROI_low_res+orig will be written at the resolution of func+orig • -input Defines the input high-resolution dataset (that needs to be converted from high resolution to low resolution) • -clip 0.5 Output voxels will only get a nonzero value if they are at least 50% filled by nonzero input voxels (you decide the percentage here). E.g., when going from high to low res, keep a label a voxel as part of the ROI if it is filled with at least 50% (or more) of the voxel value. For example: This voxel is 80% filled with the ROI value -- keep it This voxel is 30% filled with the ROI value -- lose it
This voxel is 80% filled with the ROI value -- keep it. Without the -preserve option, this voxel would be given a value of “3.2” (i.e., 80% of “4”). With -preserve, it is labeled as “4” • -preserve once it has been determined that the output voxel will be part of the ROI, preserve the original ROI value of that voxel (and not some fraction of that value). This option also allows for "voting" – determine the ROI that would most fill that voxel. For example, if our ROI mask has values of “4”: • 3dresample does conversion too but you have less controls for handling partial overlaps: 3dresample -master low_res_dset+orig \ -prefix ROI_low_res \ -inset ROI_high_res+orig \ -rmode NN • -master: the destination grid we want our ROI mask resampled to • -prefix: The output from 3dresample -- in this example, a low resolution ROI mask that corresponds with the voxel resolution of our master dataset • -inset: The ROI mask dataset that is being resampled from high to low resolution • -rmode NN: If a voxel’s “neighbor” is included in the ROI mask, include the voxel in question as well
Let’s do a class example of 3dresample: cd AFNI_data6/roi_demo 3dresample -master rall_vr+orig \ -prefix anat_roi_resam \ -inset anat_roi+orig \ -rmode NN • In this class example, we want to take our ROI mask, which has a high voxel resolution of 0.9 x 0.9 x 1.2 mm, and resample to it the lower resolution of the time-series dataset, rall_vr+orig (2.75 x 2.75 x 3.0mm). Before, overlay ROI is: anat_roi+orig 0.9x0.9x1.2 mm voxel grid After, overlay ROI is: anat_roi_resam+orig 2.75x2.75x3.0 voxel grid
3dmaskave • This ROI program computes the average of voxels (usually from a functional or time-series dataset), that are selected from an ROI mask • (interactive version: ROI Average plugin) • Class Example: 3dmaskave -mask anat_roi_resam+orig -q \ rall_vr+orig > epi_avg.1D The above command takes the voxels that fall within the ROI mask, and computes a mean for every time point/volume. In this example, there are 450 time-points in this dataset, so the output will be a column of 450 means. -q : Suppresses the voxel-count output (e.g., “[9 voxels] make up the ROI mask”) from appearing next to each mean. Alternatively, instead of having the results of3dmaskave spewed into the shell, you can redirect ( > ) the results into a text file (epi_avg.1D) and save them for later use.
Output will look like this (450 means in the column): more epi_avg.1D 1076.11 1086.11 1092.33 1097.33 ... 1084.76 • Data can also be plotted out using 1dplot: 1dplot epi_avg.1D or… 1dplot -yaxis 1000:1200:2:1 epi_avg.1D Mean voxel intensity for voxels falling within the ROI mask (at each timepoint). 3 concatenated EPI runs, Timepoints (0-449)
3dmaskdump • Program that dumps out all voxel values in a dataset that fall within the ROI of a given mask dataset • Class example: 3dmaskdump -noijk -mask anat_roi_resam+orig \ ‘func_slim+orig[2]’ > Vrel-tstats.txt • The output appears in the shell (unless you redirect it (>) into a text file). This example shows one column of numbers, representing the voxel values for functional sub-brick #2 (‘Visual-reliable’ t-values) that fall within the ROI mask: Dump out the voxel values from the functional dataset, sub-brick #2, but only for those voxels that fall within the ROI mask.
More than one sub-brick can be chosen at a time (e.g., func_slim+orig’[2,4-6]) • Main application of 3dmaskdump is to dump out the data or functional values that match an ROI so they can be processed in some other program (e.g., Microsoft Excel) • If -noijk option is omitted, each output line starts with ijk-indexes (i.e., location) of the voxel • Program 3dUndump can be used to create a dataset from a text file with ijk-indexes and dataset values • 3dROIstats • Program to compute separate statistics for each ROI in a dataset • E.g. Mean can be computed for severalROIs separately and simultaneously • This differs from 3dmaskave because the ROIs within a single mask are not collapsed and then averaged. Here the averages are done separately for each ROI within the mask dataset • Averaging is done over each region defined by a distinct numerical value in the ROI dataset 3rois+orig ROI 1: Left Superior Occip. Gyrus (blue) ROI 2: Left Middle Occip. Gyrus (red) ROI 3: Left Inferior Occip. Gyrus (yellow)
Example: 3dROIstats -mask 3rois+orig func_slim+orig’[0]’ Output shown in the shell (use > command to save into to a text file): File Sub-brick Mean_1 Mean_2 Mean_3 func_slim+orig 0 10.806 69.337 71.334 • The Mean_1 column is the average over the ROI whose mask value is “1”. The average is calculated for voxels from our functional dataset func_slim+orig, that fall within the ROI. Averages are computed at sub-brick #0 • Means have also been computed for ROIs whose mask value is “2” (Mean_2) and “3” (Mean_3) • Very useful if you create ROI masks for a number of subjects, using the same number codes for the same anatomical regions (e.g., 1=hippocampus, 2=amygdala, 3=superior temporal gyrus, etc.) • You can load the output of 3dROIstats into a spreadsheet for further analysis (e.g., statistics with other subjects’ data)
Method 2: Creating ROI datasets from Activation Maps • ROI masks derived from functional data can be made by finding contiguous supra (above) threshold voxel clusters in an activation (functional) map and then converting each cluster into a ROI with a separate data value • These ROIs can then be used as starting points for some analysis • Example: cd AFNI_data6/roi_demo and launch afni & • Let’s pick select some criteria that will determine how big our voxel clusters will be. Any voxels that survive these criteria will be part of our ROI mask(s) Select UnderLay: anat+orig Select OverLay: func_slim+orig --> Define OLay & Threshold: Sub-brick 0 (Full-F) --> Set Threshold to F 99.0 --> To be part of a cluster, voxels must be right next to each other, rmm = 2.75 --> Clusters must be 200+ voxels in size 2.75 x 2.75 x 3.0 = 22.69 x 200 = vmul = 4538
3dclust • The program 3dclust looks for clusters of activity that fit the criteria set on the command line, and prints out a report about the active voxels that make up the ROI cluster(s) -- similar to 3dmerge (coming up a little later), but creates a report instead of a new dataset • Example: 3dclust -1clip 99.0 2.75 4538 func_slim+orig.’[0]’ or… 3dclust -dxyz=1 -1clip 99.0 1 200 func_slim+orig.’[0]’ • The above command tells 3dclust to find potential cluster volumes for dataset func_slim+orig, sub-brick #0, where the threshold has been set to 99.0 (i.e., ignore voxels with an activation threshold <99.0). Voxels must be no more than 2.75mm apart, and cluster volume must be at least 4538 micro-liters in size (if using the -dxyz=1 option, voxels will be no more than 1mm apart and vmul will be 200). • Once these ROI clusters have been identified, a report will be printed out:
Clusterize • The Clusterize button on the main AFNI graphical interface gives users a quick and easy way to locate clusters of activity in a functional dataset. Once the user sets the clusterize parameters, a complete cluster “report” is given, which details the number of clusters found, based on these parameters. rmm=0: similar to using the dxyz=1 option in 3dclust
Cool Clusterize Features Jump: sets the crosshairs to the designated xyz coordinates (default is the peak of the ROI cluster) Flash: flashes the cluster voxels in the image viewer SaveMask: Click on this button to write clusters to a mask dataset called Clust_mask+orig Plot/Save: Allows user to load a 3D+time dataset (Aux Dset button) and plot the avg time series over a cluster. Plot can be saved in .jpg or .png format. Cluster #1 Cluster #2 Clust_mask+orig E.g., 3D+time dataset rall_vr+orig loaded and avg time series plotted for voxels within Cluster #1
3dmerge • The program 3dmerge can find contiguous supra (above) threshold voxel clusters in an activation (functional) map and then convert each cluster into a ROI with a separate data value. These clusters are then saved as a mask dataset. • Similar to the Clusterize button on the AFNI interface, but done on the command line instead. • Example: 3dmerge -prefix func_roi -dxyz=1 -1clip 99.0 \ -1clust_order 1 200 func_slim+orig.’[0]’ • The result: 2 clusters survived our criteria: ROI 2 ULay: anat+orig OLay: func_roi+orig ROI 1
0 1 2 3 4 5 6 7 8 9 10 11 12 13 14 15 • In this example, 4 ROI clusters were found that fit the criteria designated by the 3dclust command. Below is an explanation of the output: • Volume: Size of each cluster volume • CM RL: Center of mass (CM) for each cluster in the Right-Left direction • CM AP: Center of mass for each cluster in the Anterior-Posterior direction • CM IS: Center of mass for each cluster in the Inferior-Superior direction • minRL,maxRL: Bounding box for cluster, min & max coordinates in R-L direction • minAP,maxAP: Bounding box for cluster, min & max coordinates in A-P direction • minIS, maxIS: Bounding box for cluster, min & max coordinates in I-S direction • Mean: Mean value for each volume cluster • SEM: Standard error of the mean for the volume cluster • Max Int: Maximum Intensity (peak) value for each volume cluster • MI RL: Peak value coordinate, R-L direction of each volume cluster • MI AP: Peak value coordinate, A-P direction of each volume cluster • MI IS: Peak value coordinate, I-S direction of each volume cluster
Getting around with spheres Another way to use cluster results – make spheres from the cluster peaks or centers of mass Try this: adwarp -aparanat+tlrc -dparfunc_slim+orig –dxyz 3 In afni GUI, select Underlay: anat, Overlay: func_slim Switch view to Talairach Overlay to vrel_coef, Threshold to vrel_tstat Clusterize, and Save Tabl 1dcat Clust_table.1D'[4..6]' > Clust_PeakXYZ.1D 3dUndump -srad 7.5 -master func_slim+tlrc -orient RAI \ -prefix clust_spheres -xyz Clust_PeakXYZ.1D
Method 3: Creating ROI datasets from Atlases: AFNI program whereami • AFNI comes with a collection of atlas datasets • Stored in same directory with binaries, user face files, and so on • Have you tried example #2 from imcat -help ? • Atlas dataset names are of the form TT_something+tlrc.HEAD / .BRIK • The whereami command line program can create a mask dataset using an atlas dataset and a name of a region stored inside the atlas dataset • Example: whereami -mask_atlas_regionTT_Daemon:left:hippocampus \ -prefix Lhip • Produces a mask dataset named Lhip+tlrc.HEAD / .BRIK containing the voxels defined in theTalairachDaemon as being in the left hippocampus • To see ALL the regions available in all the atlases, type the command whereami -show_atlas_code | less • You could create multiple masks this way and then combine them into a multi-region ROI mask using 3dcalc • You may want to use such automatic atlas-generated masks as a starting point for custom editing of the mask for each subject (using Draw Datasetplugin)
whereami can provide the user with more detailed information regarding the output of 3dclust • For instance, say you want more information regarding the center of mass voxels from each cluster (from the 3dclust output). I.e., where do they fall approximately within the atlases? 3dclust -dxyz=1 -1clip 99.0 1 200 func_FullF+tlrc > clusts.1D whereami -coord_file clusts.1D'[1,2,3]' -tab | less Center of mass output, columns 1,2,3, from 3dclust output (see pg. 25). Shown: Cluster #1’s coordinates according to various atlases (TT, MNI, etc), as well as the name of the anatomical structure that is located at or near these coordinates (which may vary by atlas) etc…
whereami can extract ROIs for various atlas regions using symbolic notation whereami -mask_atlas_region TT_Daemon:left:amy • The above command will use the Talairach-Tourneaux atlas (TT_Daemon:)to create an ROI of the left amygdala (left:amy). • Seewhereami -helpfor more details regarding available atlases • Result: An ROI dataset calledTT_Daemon.amy.l+tlrc.HEAD/BRIK: ULay: anat+tlrc OLay: TT_Daemon.amy.l.tlrc
whereami can report on the overlap of ROIs with atlas-defined regions whereami -omask anat_roi+tlrc
You can also specify atlas-based ROI masks directly like this: 3dmaskave -mask TT_Daemon:left:hippocampus func_FullF+tlrc • In the above single command, 2 things will occur: • The Talairach-Tourneaux atlas will be used to create an ROI mask of the left hippocampus, which will be applied to the dataset func_FullF+tlrc (note: this dataset has one sub-brick in it - small and simple, for demo purposes). • A mean will be calculated for the voxels in dataset func_FullF+tlrc that fall within the ROI mask. • Output from above command shows up on the terminal like this: Or 3dcalc -prefix nice_roi \ -a ‘CA_N27_ML::hippo’ -b ‘func_FullF+tlrc’ \ -expr ‘(step(a)*b)’ • Result: ULay: anat+tlrc OLay: nice_roi+tlrc F-stat voxels in func dataset that fall within the TT left hippocampus ROI
Above examples use a feature of the AFNI software package to create datasets from atlas regions on the fly • Creation of a 0-or-1 mask dataset directly on the command line using a dataset name of the form Atlas_name:Hemisphere:Region_name • Using this feature, you don’t have to create the mask using the whereami program and then use it later— you can create it and use it at the same time • Example 9 from 3dcalc -help: Compare the left and right amygdala between the Talairach atlas, and the CA_N27_ML atlas. The result will be 1 if a voxel is marked as amygdala in the TT_Daemon only, 2 if it is marked as amygdala in the CA_N27_ML only, and 3 where they overlap. 3dcalc -a 'TT_Daemon::amygdala' \ -b 'CA_N27_ML::amygdala' \ -expr 'step(a)+2*step(b)’\ -prefix compare.maps • For more information about 3dcalc , see the AFNI Utilities presentation Note: compare.maps+tlrc displays the TT amygdala (value=1) in green, the N27 amygdala (value=2) in orange, and the overlap between the two atlases (value=3) in red.
Atlases Distributed With AFNITT_Daemon • TT_Daemon : Created by tracing Talairach and Tournoux brain illustrations. • Generously contributed by Jack Lancaster and Peter Fox of RIC UTHSCSA)
Atlases Distributed With AFNIAnatomy Toolbox: Prob. Maps, Max. Prob. Maps • CA_N27_MPM, CA_N27_ML, CA_N27_PM: Anatomy Toolbox's atlases with some created from cytoarchitectonic studies of 10 human post-mortem brains • Generously contributed by Simon Eickhoff, Katrin Amunts and Karl Zilles of IME, Julich, Germany
Atlases Distributed With AFNI:Anatomy Toolbox: MacroLabels • CA_N27_MPM, CA_N27_ML, CA_N27_PM: Anatomy Toolbox's atlases with some created from cytoarchitectonic studies of 10 human post-mortem brains • Generously contributed by Simon Eickhoff, Katrin Amunts and Karl Zilles of IME, Julich, Germany
Circularity • Using results from one set of data to limit the data in that same set. • FMRI example: • Find largest differences with some threshold between groups A and B • Create ROIs from those differences • Show differences between ROIs for the same two groups showing that indeed A is very different from B with a p-value of 0.05. They're different because they're different. • Solution : Use ROIs from independent data: Atlas regions, locator tasks, other subjects
ROIs from Locator session day 1 applied to session day 2 EPI Session 1 – Locator Task Session 2 - Task structural-functional alignment from align_epi_anat.py (affine) structural-functional alignment from align_epi_anat.py (affine) Freesurfer Seg. (Atlas) Anat1 Anat2 Locator TR=0 EPI_RUN1 TR=0 Locator TR=1 Locator TR=n EPI_RUN1 TR=1 EPI_RUN1 TR=n ... ... motion correction xforms from 3dvolreg EPI_RUN2 TR=0 EPI_RUN2 TR=1 EPI_RUN2 TR=n cluster ROI 1 ... ... cluster ROI 2 cluster ROI m motion correction xforms from 3dvolreg align_epi_anat a2 to e2 => a2e2.aff12.1D align_epi_anat a1 to a2 => a1a2.aff12.1D align_epi_anat L1 to a1 => L1a1.aff12.1D cat_matvec a2e2.aff12.1D a1a2.aff12.1D L1a1.aff12.1D > L1e2.aff12.1D 3dAllineate -1Dmatrix_apply L1e2.aff12.1D –final NN –prefix ROI1_e2 \ -base epi_run1+orig'[1]' –input ROI1+orig e2 -> a2 a2 -> a1 a1 -> L1 e2 -> L1 Known or User-defined transformations Transformation Resource Same space / Identity xform Dataset