Download
1 / 23
230 likes | 349 Vues
Development of non-intersecting transverse and longitudinal Profile Monitors P. Forck, A. Bank, W. Barth, C. Dorn, A. Peters, H. Reeg Gesellschaft f ür Schwerionenforschung, Darmstadt HIPPI Meeting 2005, Oxford Non intersecting methods for:

E N D
Development of non-intersecting transverse and longitudinal Profile Monitors P. Forck, A. Bank, W. Barth, C. Dorn, A. Peters, H. Reeg Gesellschaft für Schwerionenforschung, Darmstadt HIPPI Meeting 2005, Oxford Non intersecting methods for: • Preventing destruction of intersecting material • Parallel observation at different locations • Monitoring of possible time-varying processes • Goal: Same precision as intersecting methods Outline: • Transverse profile monitor by Beam Induced Fluorescence BIF • Bunch Structure Monitor BSM based on residual gas electron spectroscopy • Transmission control by transformers
The UNILAC Facility at GSI Achieved current for U-beam (tpulse = 200 μs) U73+: 2 emA U28+: 5 emA U4+: 16 emA 11.4 MeV/u 1.4 MeV/u Alvarez DTL High Current Injector (RFQ&IH) Single Gap Resonators
Basics of Beam Induced Fluorescence Physics of fluorescence for N2 residual gas: p + N2 p + (N2+)*+ e- p + N2+ + + e- • Excitation of residual gas molecules by beam’s energy loss • Decay of N2+ levels generate light, blue light 390 nm < < 470 nm, lifetime = 60 ns. Realizations at Los Alamos, CERN, Orsay/Saclay, Uni-Frankfurt, GSI, COSY …. Fluorescence of 200 keV p in N2 (1961) LANL (D. Gilpatrick et al.) p at MeV in 5*10-5 mbar N2 Spectrum confirmed at CERN-PS/SPS from 1 to 450 GeV.
Image Intensifier used at GSI-LINAC Technical realization of image intensifier at GSI: • Photo cathode S20 UV: γ-e- conversion, 15 to 25 % efficiency, 200 nm < λ < 650 nm • Two step MCP (25 mm diameter): 106 fold amplification • P 46 phosphor: e- -γconversion, 300 ns decay, 500 nm < λ < 600 nm • Minifying taper coupling to CCD chip (1/2’’): 7% transmission • Digital camera (Basler A311f): Firewire interface
Test Setup at GSI-LINAC Installation behind Alvarez at 11 MeV/u Compact chamber with 150 mm insertion:
Typical Result at GSI-LINAC Features: • Single photon counting • High resolution (here 0.3 mm/pixel), can easily be matched to application • Low background (sometime larger contribution by neutrons and ) Beam parameters at GSI-LINAC: 4.7 MeV/u Ar10+ beam I=2.5 mA equals to 1011 particles One single macro pulse of 200 s Vacuum pressure: p=10-5 mbar (N2) bump restricted ~1 m, no influence to beam detected
Application of Beam Induced Fluorescence Special application Variation during the macro pulse detectable: Switching of image intensifier Exposure window during macro-pulse Signal treatment Statistics offers ‘offline’ optimization statistics integration time resolution Beam parameter: Ar10+ at 11 MeV/u with 8 mA
In Preparation: Digital Interface for Firewire Digital camera offers:no loss of data-quality, versatile trigger, variable exposure time CCD-camera: Basler A311f featuring 649x494 pixels, 12 bit, 50 frames/s, IEEE 1394b Iris/MCP-gain variation: Remote controlled iris by local, ethernet based DAC Readout:HUB optical fiber real-time controller running RT-LabVIEW (NI) Status: DAQ in preliminary design phase DAQ System: LabVIEW Software:
Novel Device for non-intersecting Bunch Shape Measurement Bunch-Shape seldom measured ! Scheme for novel device: • Secondary electrons for residual gas • Acceleration by electric field • Target localization by apertures and electro-static analyzer (Δy = 0.2 to 2 mm, Δz=0.2 to 1 mm) • rf-resonator as ‘time-to-space’ converter same as intersecting method (INR-Moscow) • Readout Ø70 mm MCP + Phosphor + CCD • Measurement done within one macro-pulse (not yet achieved due to back-ground)
Realization for Bunch Shape Monitor at UNILAC E-field and the energy-analyzer: Installation for beam based tests:
First Results from Bunch Shape Measurement at UNILAC Time information carried by the residual gas e- is transferred to spatial differences: Features: Single electron detection Recorded within few macro-pulses Resolution better 50 ps = 20@108MHz Pressure bump required • Back-ground should be suppressed Beam parameters: Ni14+ at 11.4 MeV/u I=1.5 mA, 200 μs macro pulse Average: 8 macro pulses Pressure p=2*10-6 mbar Deflector power P=15 W
First Application from Bunch Shape Measurement Variation of buncher: • Bunch shape was determined, influeneced by buncher • Pick-up: No measurable influence • Emittance determination possible Beam parameters: Ni14+ at 11.4 MeV/u I=2 emA, 200 μs macro pulse Average: 4 macro pulses Pressure p=10-5 mbar
Beam Space Charge Contribution The residual gas e- are influenced by beam’s E-field in addition to the monitor E-field Simulation of influence for different currents: Simulation method: e- trajectory calc. inside beam pipe & linear optics for energy analyzer Simulation parameter: Ekin= 11.4 MeV/u Parabolic bunch shape ∓0.5 ns longitudinal root points ∓5 mm transversal root points Variation of current (as for Ni14+ ) Simulation result: stronger influence as for standard method, but still acceptable
Dynamic Transmission control at UNILAC Variation of maximal loss via software input: 8 different input thresholds 8 different macro-pulse duration by electric chopper in front of RFQ • Save protection of equipment. FPGA-electronics: ACCT V/f-converter Up/down-counter: 1st ACCT ↑, 2nd ↓ Digital comparator chopper ACCT clamping Integration window ACCT signal 40 μs/div
Conclusion and Outlook Beam Induced Fluorescence BIF: First prototype in operation for ‘single photon counting’, usable during UNILAC operation Data acquisition in design phase (responsible engineer just hired) More investigation with high current required possible problems: broadening by space charge field, two-step excitation…. Non-intersecting Bunch Shape Monitor: Prove-of-principle performed, resolution lower than 50 ps = 20 @ 108 MHz Improvements for back-ground suppression in preparation beam test necessary Calculations and measurements of signal deformation due to beam space charge required Device in experimental condition engineering design for operation required Dynamic Transmission control: System design finished Hardware in operation Improvements of operation control required
Comparison for different Gases at p Source (Saclay) Choice of fluorescence gas: • High fluorescence yield at optical wave-length • Short lifetime of excited level • Good vacuum pumping Results: Profile is independent of gas Care: • Long lifetime (N2+: 60 ns) broadening by beam space charge • Light emitted by primary ions e.g. p + N2 H* + N2+ (only important for Ekin<1 MeV) • At large N2 density (p>10-3 mbar): Two-step processes e.g. N2+ e- N2* + e- possible Example: Ion source100 keV, 100 mA protons P. Ausset et al. (Orsay/Saclay) N2,Ne Ar,Kr Xe Profiles from different gasses
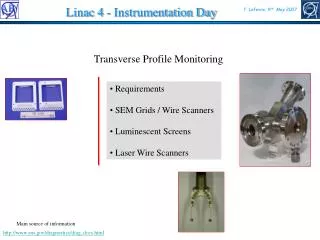
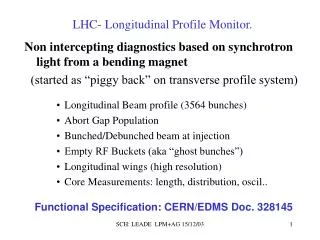
Non-intercepting Profile Measurement based on Energy Loss Standard monitors: SEM-Grid, Wire-Scanner, Scintillation Screen, OTR-Screen… Disadvantage: intercepting, problems for time-varying processes Non-intercepting profile measurement: • Large beam power can destroy the material • Synchrotron: Monitoring during full cycle • LINAC: Monitoring at different locations, variation during the macro-pulse Physics:electronic stopping power Bethe-Bloch formula: - dE/dx = const · Zt ρt/At · Zp2 · 1/β2 · [ ln(const ·γ2β2/I) – β2] M. Plum et al.: p in N2 at CERN-PS cross section α dE/dx pc [GeV] ~ 1/Ekin (for Ekin> 1GeV nearly constant) Target e--density Strong dependence on projectile charge • Profile determination from ionization and excitation of residual gas.
Technical Realization Possibilities for BIF Single MCP: - lower 103-fold amp. + higher resolution Example: CERN-SPS (160 μm/pix), R. Jung et al. Double MCP: +single photon, 106-fold amp. -resolution limited (MCP-channels) Example: GSI-LINAC (300 μm/pixel) Photo-cathode: Only for required wavelength interval to avoid dark currents, e.g. S20UV: 200<λ<650 nm dark rate 500 e-/cm2/s, S25red:300<λ<900 nm 30000 e-/cm2/s Phosphor: Fast decay ↔ lower sensitivity e.g. P47: τ = 0.1 μs, P43: τ = 1000 μs IP43~ 4 · IP47 Problem: Radiation hardness of CCD camera
BIF at Synchrotrons Example: CERN SPS and PSB,PS (R. Jung, M. Plum et al.) Photon yield scales like Bethe-Bloch energy loss ΔEd for p with 100 MeV < E kin < 450 GeV Method: fluorescence decay by ~5 ns long bunches Comparison to wire scanner at SPS
Standard Bunch Shape Determination Standard intersecting method developed by INR-Moscow (A. Feschenko, P. Ostrumov et al.): Insertion of a 0. 1 mm wire at 10 kV Emission of e- within < 0.1 ps Acceleration toward 1mm slit Rf-deflector as time-to-space converter Detection with Slit+Cup or MCP Resolution better 1o or 10 ps
Dynamic Transmission control at UNILAC Verification for transmission control: Artificial beam loss by quadrupole variation chopper window decrease 40 μs/div