Download

1 / 1
10 likes | 164 Vues
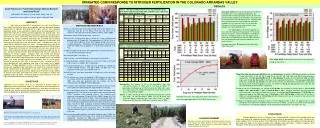
Winter Annual Weeds Effect on Corn Response to Nitrogen. Introduction. Chlorophyll Meter Readings and Grain Yield. Results.

E N D
Winter Annual Weeds Effect on Corn Response to Nitrogen Introduction Chlorophyll Meter Readings and Grain Yield Results Delaying burndown until May after the corn had emerged significantly lowered the chlorophyll meter reading at R1-R2 over early pre-plant control (Figure 6). This suggests that the N mobilized into above-ground WAW biomass by mid-May in 2010 could significantly reduce cumulative corn N uptake by July (R1-R2). However, grain yield was not significantly impacted by the time of burndown (Figure 7), though it trended toward a similar pattern as the chlorophyll meter reading data (Figure 6). Winter Annual Weed Density, Biomass, and N Uptake When to control winter annual weeds (WAWs) is a management concern for producers. Reduced tillage, lack of winter crops, herbicide programs, and late spring weed control are some factors contributing to the increased prevalence of WAWs. Evidence suggest that dense stands of WAWs slow the warming and drying of soil in the spring, interfere with planting equipment, cause allelopathic effects, and increase damage from lepidopteron in corn. The most common WAWs were henbit (Lamiumamplexicaule) and field pennycress (Thlaspiarvense). Burndown control was excellent at all locations and timings, highlighted visually in Figure 1. Average WAWs density per site ranged from 118 to 376 plants m-2. Average WAW dry biomass per site at maturity in May ranged from 562 to 1124 kg ha-1 resulting in 12 to 30 kg N ha-1 uptake in above ground WAW biomass. The C:N ratios ranged from 16:1 to 28:1. Nathan Mueller and Dorivar Ruiz Diaz, Kansas State University • In regards to corn response to nitrogen, the objective was to determine how important the timing of WAW control (Figure 1) is for no-till, rainfed corn production following soybeans by assessing: • Soil water and nitrate • Early growth and nitrogen uptake of corn • N status at silking/blister (R1-R2) • Grain yield Corn Plant Population, Early Growth, and N Uptake T x N rate interaction was not significant for any dependent variables measured. Delayed emergence was visually observed with burndown after early pre-plant. Delaying burndown until after corn emergence did not reduce corn plant populations (data not shown). Early growth was significantly affected by burndown timing (Figure 3) and was maximized by an early pre-plant burndown. N concentration in corn tissue was not significantly different for burndown timings. Therefore, N uptake (Figure 4) was mostly due to difference in early biomass accumulation. Figure 1. Osage Co. on 14 May 2010 contrasting burndown timing Figure 7. Corn grain yield Figure 6. Chlorophyll meter reading at R1-R2 Materials and Methods Summary Field research was conducted in 2010 at seven locations in Kansas (Figure 2). There were four different burndown times (T): fall, early pre-plant (2-4 weeks prior to planting), planting (within one week of planting), and emerged (at V2, two visible leaf collars). Burndown treatments consisted of glyphosate with or without 2,4-D. After the last burndown treatment, five N rates of 0, 17, 34, 67, and 135 kg N ha-1 were applied via broadcast urea. Corn was planted 12 to 20 April. In 2010, on rainfed no-till corn following soybean in Kansas: High density stands of WAWs can contain 12 to 30 kg N ha-1 at maturity in their above-ground biomass. Delaying burndown until planting or after did cause reduced early growth (V5-V8) and reduced early season N uptake. In early June, gravimetric water content was higher as a result of delaying burndown. N status at R1-R2 (assessed by chlorophyll meter readings) was only reduced if burndown was delayed until May after the emergence of corn. Grain yield was not significantly impacted by the WAW burndown timing. Increased early corn growth did not translate into higher yield in these conditions. • Soil gravimetric water content and soil nitrate-nitrogen were collected from 0 to 60 cm during early corn growth (V5-V8), as well as the aboveground corn biomass, which was analyzed for N content. Chlorophyll content values (SPAD Meter) to determine N status were taken on the ear leaf at R1-R2. Figure 3. Early growth (V5-V8) of corn Figure 4. Corn N uptake at V5-V8 Soil Nitrate-Nitrogen and Water Content Soil nitrate-nitrogen was not significantly different among burndown timings. Soil gravimetric water content increased with delayed burndown (Figure 5). Any excessive water use by WAWs with later burndown control was alleviated in 2010 by above average rainfall in May-June; reduced soil surface evaporation from increased residue cover; and reduced water use by smaller corn plants. Figure 2. Field research locations in Kansas • Experimental design was a two-factor factorial arrangement in a randomized complete block design with three replications. Data was analyzed using the MIXED procedure of SAS. Block and site was considered as random in the model. Simulation method for pairwise comparisons was used. Statistical significance was evaluated at P ≤ 0.10. Two locations (Franklin and Riley county) are being analyzed separately given late planting dates of 1 June and 25 May and are not part of this analysis. Acknowledgements Thank you to Mandy Liesch, Weston Grove, Carlos Narvaez, and Veronica Pozo for assistance. Thank you to the cooperating producers for the use of their land. Figure 5. Gravimetric water content (June)