Download
1 / 21
210 likes | 340 Vues
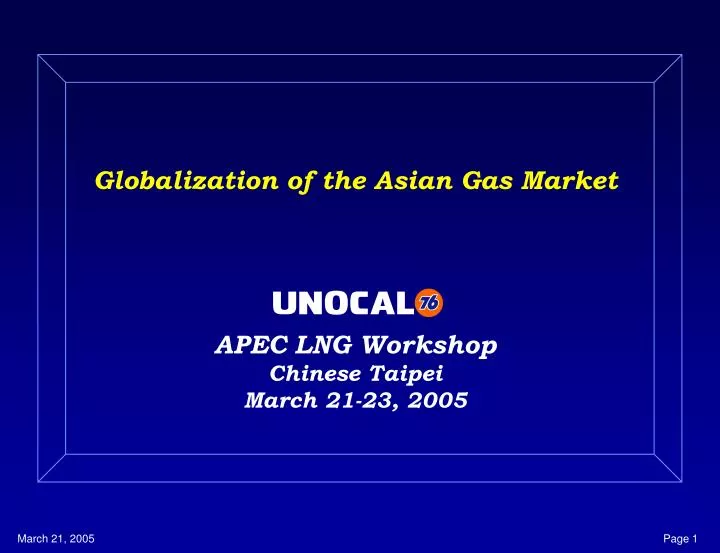
Globalization of the Asian Gas Market APEC LNG Workshop Chinese Taipei March 21-23, 2005. 70. to Power Bright Outlook!. Other. 60. Trans. Res/Comm. 6-7%. Indus. 50. Power. 40. BCFD. 30. 20. 10. 0. 2009. 2011. 2013. 2015. 2007. 1975. 1977. 1979. 1981. 1983.

E N D
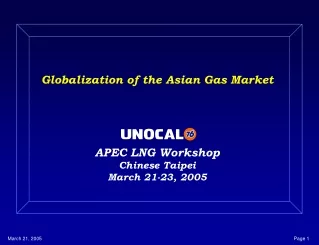
Globalization of the Asian Gas MarketAPEC LNG WorkshopChinese TaipeiMarch 21-23, 2005
70 • to Power Bright Outlook! Other 60 Trans Res/Comm 6-7% Indus 50 Power 40 BCFD 30 20 10 0 2009 2011 2013 2015 2007 1975 1977 1979 1981 1983 1985 1987 1989 1991 1993 1995 1997 1999 2001 2003 2005 Asia Pacific Gas Demand Source : Facts
2003 2015 Asia Pacific Gas Demand Emerging Markets With Regional Influence 14000 12000 10000 8000 MMCFD 6000 4000 2000 0 NZ HK Bru Aus Viet Pak Thai Phili India Myan Bang Malay China Japan Korea S'Pore Taiwan Indonesia Source : Facts
2003 2015 Asia Pacific Gas Imports 10000 Emerging Markets With Regional Influence 9000 8000 7000 6000 MMCFD 5000 4000 3000 2000 1000 0 NZ HK Bru Aus Viet Pak Thai Phili India Myan Bang Malay China Japan Korea S'Pore Taiwan Indonesia Source : Facts
mtpa Global LNG Demand Full History & Projection Europe/USA Asia 80% Future LNG – Global Market Linking 70% 60% Past LNG –“Asia’s Exclusive” 50% 40% Asian Market Share - % of Global Demand Global Connectivity: LNG Imports 400 In the past, Asia’s LNG imports amounted to as high as 80% of world LNG trade and was disconnected from Europe & US gas markets. With increase in US & EU LNG imports, there will be greater influence from linkage with global trade. 350 300 250 200 150 100 50 0 1972 1974 1976 1978 1980 1982 1984 1986 1988 1990 1992 1994 2016 2018 2020 1970 1996 1998 2014 2000 2008 2010 2012 2002 2004 2006
mtpa Global LNG Exports 400 Full History & A Scenario Projection 350 Africa/Other Middle East 300 Asia-Pacific 250 200 150 100 50 0 1972 1974 1976 1978 1980 1982 1984 1986 1988 1990 1992 1994 2016 2018 2020 1970 1996 1998 2014 2000 2008 2010 2012 2002 2004 2006 80% Asia-Pacific Future LNG – Global Market Linking Past LNG –“Asia’s Exclusive” 60% 40% 20% Middle East 0% Global Connectivity: LNG Exports Such linkage is further reinforced along the supply side with greater expansion of Middle East LNG into the Atlantic Basin supplying EU/USA as well as Asia Pacific markets. Asia-Pacific vs Middle East LNG Exports Share - % of Global LNG
Asian Gas Market Fundamentals Growth–strong fundamentals with developing economies • Strong demand continues for natural gas in Asian markets • Large emerging regional markets in China and India • Large Markets of US and EU still growing due to declining & expensive domestic options Connectivity–linkage of global & regional markets • Growth in US & Europe LNG imports from the Middle East increasing • Asia Pacific markets linkage to the US West Coast projected • North Asia Customers diversifying as new green-field plants are developed – Reliability is paramount!
Asia Power: Gas vsCoal While gas is the preferred environmental fuel, coal will continue to dominate and gas will have to compete more against coal in emerging markets. Though Coal will face more opposition . Nuclear will also face more political constraints and limits the amount of coal that could be mitigated by nuclear.
¢/kWh 6.0 FO $30/bbl FO $ 24 FO $ 21 FO $ 18 6.0 - 6.5¢/kWh Coal $ 64 /ton Coal $ 56/ton Coal $ 48 Coal $ 40 NG $ 5.0 $/MMBTU NG $ 4.5 NG $ 4.0 NG $ 3.5 NG $ 3.0 5.0 4.0 3.0 9,400 Btu/kWh 8,500 Btu/kWh 7,100 Btu/kWh 2.0 1.0 $500/kW $800/kW $1,000/kW $2,500/kW 0.0 New CC ST FO ST Coal Nuclear CAPITAL O & M Coal $1.80 Coal $2.20 Coal $2.60 NG/FO $3.00 NG/FO $3.50 NG/FO $4.00 Gas-Fired GTCC Beats Alternatives(Gas Prices @$3.00 - $5.00/MMBtu)POWER GENERATION COST @ 80% CAPACITY FACTOR
Fuel Priorities Indigenous Piped NG (PNG) > Imported PNG > Imported LNG > Imported Coal > Oil • Economics – Efficiency - Environmental • Income for the country from taxes and royalties. • Support of the building of infrastructure. • Security of supply. • Job creation across the upstream value chain
Asia-Pacific LNG By 2008 Base Demand exceeds currently contracted supply capacity! Asia-Pacific LNG Demand Forecast Low Base High Capacity 240 Potential 200 Possible 160 Probable mtpa Targeted 120 Contracted Under Construction 80 40 Existing 0 Existing & projects targeting Asia-Pacific 2018 1997 2000 2003 2006 2009 2012 2015
Basic Landed LNG Price - Japan 9.00 8.00 Oil Parity 7.00 6.00 Japan-Current 5.00 $/MMBTU 4.00 Guangdong 3.00 2.00 1.00 0.00 10 15 20 25 30 35 40 45 50 Oil ($/Bbl) Recent LNG Pricing Trends Indications are that current high oil & coal prices and outlook for US LNG imports are already exerting some influence …. “Market”
Zeebrugge Terminal ($/mmBtu) *IPE futures prices are based on UK-National Balancing Point (NBP) ** Negative sign indicates Zeebrugge price< NBP price & vice versa
Zeebrugge Terminal ($/mmBtu) *IPE futures prices are based on UK-National Balancing Point (NBP) ** Negative sign indicates Zeebrugge price< NBP price & vice versa
Asian LNG Price Conclusions • Strong demand continues to hold energy prices in new band $40+/bbl oil / $6.00+/mmbtu gas / $60+ ton coal • New green-field LNG plants not keeping up with demand projections in the short-term • Market access to North America and Europe allows LNG to flow to highest value market – Spot Markets are emerging • LNG Prices begin to be set by Global Indices e.g. Henry Hub • Volatility in the markets will allow trading opportunities for those with receiving terminals
Dock-2 Dock-3 Dock-1 5 4 6 3 2 A 1 B C D H G F E Bontang LNG Plant Year Capacity On-LineMM MT/Yr. TRAINS A/B 1977 5.377 TRAINS C 1983 5.377 TRAIN E 1989 2.875 TRAIN F 1993 2.912 TRAIN G 1997 2.912 TRAIN H 1999 3.136 22.589 LPG Tanks • With 8 trains running, the capacity of the plant has reached 22.59 MT/year LNG, 1 MT/year LPG and 10 Mbbl/year condensates.
Unocal Indonesia Gas Developments Unocal Development Plans West Seno - Operational Greater Gendalo – 2008/9 Greater Gehem – 2011/12 Bontang West Seno Hub Capacity = 100 MMSCFD Greater Gehem Hub Capacity = 300 – 500 MMSCFD New Unocal supply of ~1 BCFD refills Bontang LNG Plant Greater Gendalo Hub Capacity = 550-650 MMSCFD