
Analysis of Mass Spectrometry Data for Absolute Intensity Measurements
This document presents a comprehensive analysis of mass spectrometry data, focusing on absolute intensity measurements across various m/z values. The data includes key metrics such as relative abundances, molecular ion peaks, and calibration points, which are essential for accurate interpretation. The analysis spans a wide range of m/z ratios, highlighting significant peaks at various intensities. This can aid in the identification of compounds and enhance the understanding of complex mixtures in analytical chemistry.

Analysis of Mass Spectrometry Data for Absolute Intensity Measurements
E N D
Presentation Transcript
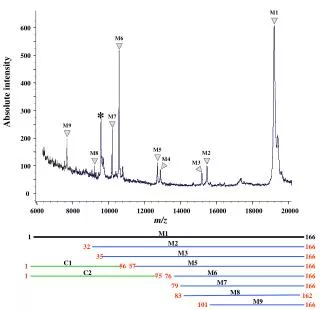
M1 1 M6 6 600 Absolute intensity 500 * * * * M7 7 400 M9 9 300 M5 5 M2 M8 2 8 M4 4 M3 3 200 100 6000 8000 10000 12000 14000 16000 18000 20000 m/z 0 M1 1 166 M2 32 166 M3 35 166 C1 M5 1 56 57 166 C2 M6 1 75 166 76 M7 79 166 M8 83 162 M9 101 166