Download
1 / 15
150 likes | 309 Vues
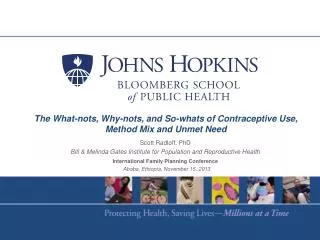
The What- nots , Why- nots , and So- whats of Contraceptive Use, Method Mix and Unmet Need. Scott Radloff, PhD Bill & Melinda Gates Institute for Population and Reproductive Health International Family Planning Conference Ababa, Ethiopia, November 15 , 2013. Presentation Themes.

E N D
The What-nots, Why-nots, and So-whats of Contraceptive Use, Method Mix and Unmet Need Scott Radloff, PhD Bill & Melinda Gates Institute for Population and Reproductive Health International Family Planning Conference Ababa, Ethiopia, November 15, 2013
Presentation Themes • International Family Planning had been recently revitalized • In 50 years, contraceptive use has dramatically increased… • …but not uniformly in pace • …or in method mix by subregions • …unmet need varies substantially across subregions and countries • …as well as across socioeconomic strata. • FP2020 offers the promise of addressing disparities in access... • …as it reduces unmet need • …for the benefit of women’s health, child health • …and for the well-being of families, communities, and nations.
International family planning: Three Eras Era One: 1965-1995 Priority Attention • Growing attention and partnerships • USAID funding and attention increased under GHI • DFID & BMGF exert leadership, sponsoring 1st ever Summit • Attention focused on high need/low income countries • Growing recognition of demographic/economic in addition to rights and health rationale • Donors attention shifts to other health priorities • Increased use of basket funding approaches • Greater disparity between middle/low income countries • USAID funding declines from 1995 peak • Rights and health rationale become primary • Dramatic growth in donor attention and funding • UNFPA established, regular international conferences held • Early policies/commitment/resources in LAC, Asia, North Africa • By early 1990s, country graduation began • Demographic and health rationale primary Era Two: 1996-2008 Growing Neglect Era Three: 2009-2020 Revitalization
Total Fertility Rate (TFR) High fertility correlates with low modern FP use (the two maps are nearly perfect negative images of each other) Modern Contraceptive Prevalence Rate (MCPR) No Data 1 - 1.8 No Data 1 - 19 1.9 - 2.5 2.6 - 4.1 20 - 41 42 - 60 4.4 - 7.4 61 - 86 Source:Population Reference Bureau. Population Data Sheet, 2011.
Modern contraceptive use worldwide has ↑ 6-fold over 50 years – and 20-fold in developing regions 2012 1960-65 Developed Countries Developed Countries 117 million women 86 million in More Developed Countries (MDCs) 31 million in Less Developed Countries (LDCs) 797 million women 152 million in MDCs 645 million in LDCs • Drivers of expanded contraceptive use: • Demand for smaller families + healthy timing/spacing of pregnancies • Improved access to family planning services • Wider range, safer, more effective and affordable method choice • Population growth (from 3 to 7 billion) Source: ”Adding It Up,” Guttmacher, 2012; Bongaarts, Population and Development Review, 1984; World Contraceptive Use 2011, UN Population Division, 2011.
Worldwide, there is a wide range of method use… CPR = 63% LAPM share of all modern method use = 57% TFR = 2.4 World …and there is a wide variation across and within regions. Source: World Contraceptive Use 2011, UN Population Division, 2011.
Contraceptive method mix differs dramatically by subregion MCPR = 70% LARC/PM share = 46% TFR = 2.1 MCPR = 54% LARC/PM share = 31% TFR = 1.5 MCPR = 23% LARC/PM share = 13% TFR = 5.1 MCPR = 52% LARC/PM share = 83% TFR = 2.7 Source: World Contraceptive Use 2011, UN Population Division, 2011.
Use + Unmet need = Total demand for FP unmet need unmet need 24% 55% Modern method use Modern method use Note: Unmet need is an indicator to track achievement of Millennium Development Goal 5, improving maternal health. Source: UN Population Division, 2012; World Contraceptive Use, 2011. Data for women married or in union.
Unmet need for FP in Developing Countries: Key facts • 867 million women want to avoid pregnancy • 645 million using a modern method • 99 million using traditional methods • 123 million using no method • Many reasons for unmet need – • Complex (e.g., access barriers; fear of side effects; partner opposition) • More than just a “supply” issue • Rises with growing demand, i.e., in part is a marker of “success” Source:“Adding It Up”, Guttmacher, 2012.
Modern method use, unmet need for modern FP & proportion of demand being met, by region – Part 1 Source: UN Department of Economic and Social Affairs, Population Division. World Contraceptive Use, 2011. Data for women married or in a union.
Modern method use, unmet need for modern FP & proportion of demand being met, by region – Part 2 Source: UN Department of Economic and Social Affairs, Population Division. World Contraceptive Use, 2011. Data for women married or in a union.
At the country-level, variations are more wide-ranging 80% 70% 60% 50% 40% 30% 20% 10% 0% Unmet Need Trad Method Modern Method • Modern contraceptive use ranges widely, from 5-57 percent. • In most countries, less than half the demand for modern FP is being met. • For every woman using modern FP, one to five women have unmet need. Source:DHS Source: DHS
Contraceptive use in Africa much lower among poorest quintile Poorest quintile Wealthiest quintile Source: Demographic and Health Surveys. Adapted and updated from L. Dougherty, “Healthy Timing and Spacing of Pregnancy,” Knowledge Management Services Project
London Summit commitments can reduce disparities • FP2020 goal of extending family planning to 120 million new users • Translates to: • 14 million fewer abortions • 43,000 fewer maternal deaths • 600,000 fewer infant deaths • As well as many other family, community, and national benefits • Key to meeting 8 MDGs Source: Global Population Assistance Report 1982-1989, 1994 (for 1950-1995 period), UNFPA; Financial Resource Flows for Population Activities in 2009 (1996-2008 data adjusted to align with GPAR categorization), UNFPA; data for 2009-2019 estimated drawing upon London FP Summit, 2012 commitments. “Adding It Up,” Guttmacher, 2012
Thank you “Family Planning 2020 (FP2020) is a global partnership that supports the rights of women and girls to decide, freely and for themselves, whether, when, and how many children they want to have. FP2020 works with governments, civil society, multi-lateral organizations, donors, the private sector, and the research and development community to enable 120 million more women and girls to use contraceptives by 2020.” -- FP2020 website