Download
1 / 48
480 likes | 621 Vues
Hispanics, Immigrants and The United States-Mexico Border. Prepared by Eva M. Moya, LMSW Healthy Border Program. U.S. - Mexico Border Part 1. Photo: National Geography 1997 12 million inhabitants Dangerous territory, heavily fortified and certainly the busiest border

E N D
Hispanics, Immigrants and The United States-Mexico Border Prepared by Eva M. Moya, LMSW Healthy Border Program
U.S. - Mexico Border Part 1 • Photo: National Geography 1997 • 12 million inhabitants • Dangerous territory, heavily fortified and certainly the busiest border • 400 million border north-bound crossings annually (1998)
2000 miles from east to west – Its dry, desert land, deadly hot. 10 border states (4 in the US and 6 in Mexico) Border is defined as 62 miles north and south of the legal boundary
U.S.-Mexico Border • United States- Mexico Border is characterized by: • Different cultures and languages (historically agricultural) • Different economic development & severe macro-economic issues • High population growth • Different health systems • Higher unemployment rates in the U.S. border • Two independent sovereign nations • Beautiful region with a mystique, soul and spirit of its own • All of the above blend on the border
U.S.-Mexico Border • However, border communities: • Share a wealth of human potential and resources • Share the same land, drink the same water and breath the same air • Common health and environment problems • Mutual economic development and dependence • Lack universal access to quality medical care and preventive health services • Insufficient suitable land for residential development USMBHA 1998
Populations affected include NCFH, 1998 Immigrants Border crossers Tribal nations and reservations Migrant and Seasonal Workers
Population Growth Trends • In the next 8 years the Mexican Border population will double • In the next 22 years the U.S. Hispanic Population of the Border will double • In the next 43 years the U.S. population all races in the Border Counties will double
Socioeconomic Poverty • In the U.S. the border region contains five of the seven poorest MSA • In Arizona, all three main border cities have been declared EC/EZ • Over 39% of the U.S. Border population lives in poverty, tax base is weak and inadequate • In New Mexico, Dona Ana County is the 10th poorest county in the Nation • Steep decline (60%) in real wages since Mexico peso devaluation, unemployment rate has soared and wages in border counties are about 80% state wide counties
Housing Conditions on the U.S.-Mexico Border • Colonias: Symptom, not the problem Photos:Nickey 1996 /Funhavit Colonias are substandard developments lacking running water, sewage systems and often electricity. Unregulated subdivisions for under-educated consumers. Grown, in part, out of need for “cash-based” home ownership strategies
Substandard Living Conditions U.S.-Mexico Border • Colonias in the U.S. Border • Environmental degradationDr.Nickey, 1997 • Infectious diseases:TB, Hepatitis (Salmonella and Shigella 3 to 4 times the national rate) • All border counties are declared as medically underserved areas • Shortage of health care professionals
Leading Causes of Death Along the U.S.-Mexico Border(in order of importance) • U.S. All Races • Disease of the heart • Cancer • Cerebrovascular • Disease • Pulmonary Chronic • Disease • Accidents • Pneumonia/ Influenza • Diabetes • Suicide • HIV/ AIDS • Homicide • Hispanics • Disease of the heart • Cancer • Accidents • Cerebrovascular Disease • Homicides • Diabetes • HIV/ AIDS • Cirrhosis • Pneumonia/ Influenza • Perinatal Deaths • Mexico • Disease of the heart • Cancer • Accidents • Diabetes • Perinatal Deaths • Cerebrovascular Disease • Cirrhosis • Pneumonia/ Influenza • Homicides • Intestinal Infectious • Disease
Issues Associated with Access to Health Care Along the U.S.-Mexico Border • Lack of knowledge on how to access services; • Language and cultural barriers; • Cost of care; • Need for training and distribution of health care providers; • Denial of access to services for undocumented (illegal status) individuals; • Availability of services; and • Transportation (distance/means of) (UA, RHO Border Vision Fronteriza Initiative, Delphi Study, 1997)
U.S.-Mexico Border • Disease knows no border. It does not need a visa. It travels at will and it kills at will. Dr. Nixon, Texas Medical Society 1994 USMBHA, 1998
Eva M. Moya: Population Size and Composition 12% of the U.S. population is Hispanic. People of Mexican origin comprise approximately 66% of the U.S. Hispanic population. Latinos/Hispanics are now the largest minority in the country. In March 2000, 32.8 million Hispanics lived in the United States. Latinos and Immigrants are changing the face of the USA Source: Current Population Survey, March 2000, PGP-4
Age Among Hispanics, Mexicans have the largest proportion of people under age 18 (38 percent). The Hispanic population is younger than the non-Hispanic White population. One-third of Hispanics are under age 18. Source: Current Population Survey, March 2000, PGP-4
Age Distribution by Sex and Hispanic Origin: 2000 (In percent) Non-Hispanic White Hispanic age Male Female Male Female Source: Current Population Survey, March 2000, PGP-4
Percent of Population Aged 65 and Over by Hispanic Origin: 2000 Percent Source: Current Population Survey, March 2000, PGP-4
U.S. Citizenship of the Foreign-Born Hispanic Population by Year of Entry: 2000 (in percent) Percent Source: Current Population Survey, March 2000, PGP-4
Family Households by Type and Hispanic Origin: 2000 Hispanic Non-Hispanic White Male householder, no spouse present Female householder, no spouse present Married couple Source: Current Population Survey, March 2000, PGP-4
Marital Status by Hispanic Origin: 2000 (Population 15 years and over) Non-Hispanic White Hispanic Married Widowed Divorced/Separated Never Married Source: Current Population Survey, March 2000, PGP-4
Educational Attainment by Hispanic Origin: 2000 (Population 25 years and over) Percent Source: Current Population Survey, March 2000, PGP-4
Percent of Population with a Bachelor’s Degree or Higher by Hispanic Origin: 2000 (Population 25 years and over) Percent Source: Current Population Survey, March 2000, PGP-4
Economic Characteristics Hispanics were more likely to be unemployed in March 2000 compared to non-Hispanic Whites. Among employed Hispanics in March 2000, the most common occupations were: • service workers • precision production, craft, repair • transportation Source: Current Population Survey, March 2000, PGP-4
Operators, laborers Managerial, professional Farming Precision production Service Current Occupation for Men by Hispanic Origin: 2000 Hispanic Non-Hispanic White Technical, sales Source: Current Population Survey, March 2000, PGP-4
Operators, laborers Managerial, professional Farming Precision production Service Current Occupation for Women by Hispanic Origin: 2000 Hispanic Non-Hispanic White Technical, sales Source: Current Population Survey, March 2000, PGP-4
Percent of Population with Full Time, Year Round Earnings of Less Than $30,000 in 1999 by Sex and Hispanic Origin: 2000 (Population 15 years and over with earnings) Percent Source: Current Population Survey, March 2000, PGP-4
Percent Below Poverty Level in 1999 by Age and Hispanic Origin Percent Source: Current Population Survey, March 2000, PGP-4
Regional Population Distribution by Hispanic Origin: 2000 Non-Hispanic White Hispanic Northeast Midwest South West Source: Current Population Survey, March 2000, PGP-4
Part III Today’s ImmigrantsLooking for a Better Life“What if suddenly the continent turned upside down? What if the U.S. was Mexico? What if 200,000 Anglo Saxians were to cross the border each month, to work as gardeners, waiters….fruit pickers…What if you were you and tu fueras I?Poet, Guillermo Gomez Pena.
Immigration is the driving force behind a significant transformation of America.Census projections assume that ethnic and racial categories are enduring and less static. These may be irrelevant in 3 generations. Complex and charged phenomenon
Migrant Flows • Legal Immigrants: foreign-born admitted to reside permanently in the US as LPR. (family-sponsored or employment-based. • Refugee: person outside of the US who seeks protection-fears persecution in homeland. • Asylee, person who already entered the US and who fears persecution. • Undocumented Immigrant/Unauthorized Migrants: present in the US without permission. • Non-immigrant: permitted to enter the US for a period of limited duration (temporary visa) • Naturalized Citizen: LPR eligible t apply for citizenship through a process of naturalization.
Fast Facts on Today’s Newcomers • Did you know that…. About 75% immigrants enter the United States legally.About three quarters come to join family.Nearly 10% United States Population are foreign born.Many undocumented don’t come to United States by crossing border illegally.One third of United States Populations in 1997 were naturalized citizens.
Immigrants are changed by the experience of immigration. The process of uprooting and resettlement. “here and now” and “there and when”Change of host societies in profound ways, schools, media, work and places of worship have all been transformed.Mourning of people and places loved.
Learning to work with our hands and to work hard form a very young age • “We are just trying to make a life” • “The Children are the bridge between their parents and the culture form the very beginning” • “The believe in the American Dream is real” • “Dedicated to hard work. Little use of welfare, strong families, and an entrepreneurial spirit” • “The lowest rate of medical insurance” • “Land of opportunity and a culture of optimism and cultural values”
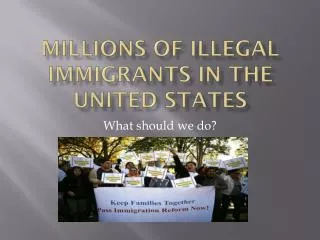
The NumbersDaily 1000 undocumented immigrants cross the border from Mexico illegally.Nothing stops the steady flow of immigration, not higher fences or new laws.The problems steams from: Laws of supply and demand.In USA = I hr work = 1-2 days in Mexico 30.5 million immigrants in the USA = 11% of pop.
Reality is simplePeople leave their countries because of push and pull factors- Lack of work, low levels of education, political repression – and they come to the U.S.A because of pull factors – there are needed.Account for more than 34% of domestic employees23% of farmers and fishermen, 21%assembly line workers,18% industry and 4% hotel/restaurants.Growth is rapid and highly segregated in the workplace, schools and neighborhoods.
Where do Immigrants Come From? • In 1998, top 5 countries United States received legal immigrants were: • Mexico (131,575) • China (36,884) • India (36,482) • Philippines (34,446) • Dominican Republic (20,387)
Immigration will continue to be a powerful vector of change on both sides of the Border. We need to better understand how it is transforming both countries. Family reunifications and transnational networks will continue to play a key part .
Where do Refugees Come From? • In 1998, 10 top places were: • Bosnia and Herzegovina • Former Soviet Union • Vietnam • Somalia • Iran • Cuba • Liberia • Iraq • Sudan, and • Burma
Immigrants & the Economy • Net economic gains for domestic residents (1-10 billion a year) • Immigrant remittances and investments are vital to emigrant communities. • Pay their own way • Naturalized Citizens pay more than their share • Immigrant-Founded Business • Net economic contributors • An education and training windfall • Essential to economy • Less likely to receive welfare than natives • Their value is beyond fiscal calculations
Challenges and Opportunities • Promote cooperation and increase level of resources to improve health prevention and health alternatives • Frame immigration and migration from endangering cultural forms to opportunities that dignify people • Build political will to collaborate and share authority to address needs • Prepare professional, educate policy makers and activists on the border and immigrant/migrant cultures: synergistic, dynamic and unique • Need a major research agenda to examine the long-term causes and consequences of immigration. • Support ethnographic and quantitative studies that describe and explain the emerging health issues for guiding strategies for action
Challenges and Opportunities • Advocate for health parity and human rights that eliminate anger, discrimination and opposition. • Conduct and fund immigration and migrant research and services. • Integrate public health functions • Keep up with the new growth pressures of the infrastructure (water scarcity) • Strengthen preventive diplomacy to prevent conflict • Transfer knowledge to increase health care management and access capacity • Create a border culture that fosters binational and cross-border service utilization
Challenges and Opportunities • Create comprehensive health measures. However, there can probably be no improvement in general health unless the basic problems of the environment, sanitation, safe drinking water, affordable housing are resolved • Equal opportunities for all (education, health and business) • Increase and strengthen community capacity to address proactive, asset-based and resiliency factors • Strengthen and expand asset-based housing initiatives and health insurance coverage
Basic Elements of Border Cooperation • Identification of a common problem • Recognition that each country is independent • Trust and respect • Consensus in decision making • Equitable allocation of resources PAHO/ Filed Office 1999
Nurture the spirit of welcome and not of suspicion.Immigrants are at the heart of what makes this great country the most prosperous and visionary