Introduction to Epidemiologic Methods
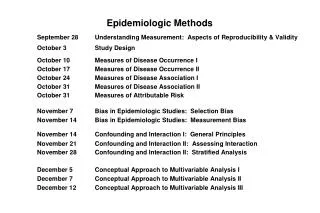
Introduction to Epidemiologic Methods. Tuesday 9:30 – 10:30 am. What is Epidemiology?. Kuller LH: Am J Epid 1991;134:1051 Epidemiology is the study of “epidemics” and their prevention.

Introduction to Epidemiologic Methods
E N D
Presentation Transcript
Introduction to Epidemiologic Methods Tuesday 9:30 – 10:30 am
What is Epidemiology? • Kuller LH: Am J Epid 1991;134:1051 Epidemiology is the study of “epidemics” and their prevention. • The study of the distribution and determinants (risk factors) for disease frequency in human populations and the application of this study to the control disease/health problems.
Fundamental Assumptions of Epidemiology • Human disease does not occur at random • Human disease has causal and preventive factors that can be identified through systematic investigation of different populations or sub-groups of individuals within a population in different places or at different times.
Basic Components of Epi Mtds & Principles • Distribution: Who is getting the disease within the population? • Provides insights to hypothesis formulation about possible causal/preventive factors • Frequency: How many people are getting the disease in a given place and at a given point in time? • The availability of data is a prerequisite for any systematic investigation of patterns of disease occurrence in human populations. • Determinants: What are the risk factors for the disease among those affected?
What Is The Unique Skill Of Epidemiologists? MEASURING DISEASE FREQUENCY IN POPULATIONS
Classifying and categorizing disease Deciding what constitutes a case of disease in a study Finding a source for ascertaining the cases Defining the population at risk of disease Defining the period of time of risk of disease Obtaining permission to study people Making measurements of disease frequency Relating cases to population and time at risk Measuring Disease Frequency Has Several Components
The Progression of Epidemiologic Reasoning Suspicion Hypothesis Hypothesis Testing in Studies Validity Assessment Inference/ Conclusion • Suspicion about a factor’s role leads to Hypothesis generation. Hypothesis could rise from clinical practice, examination of disease patterns, observations from lab research, theoretical speculation. • Test Hypothesis in Epi studies using various study designs • Hypothesis testing involves both exploratory (descriptive) and confirmatory analyses from which statistical associations are made regarding if the probability of disease in the presence of a given factor is more than the corresponding probability in its absence
Epi Reasoning Cont. • Examine the validity of observed association by excluding possible explanations: • Luck of draw (chance), systematic errors (bias) and extraneous factors (confounding). • Make judgment regarding the extent to which an observed association represents a cause-effect relationship between exposure and disease. • This judgment requires inferences far beyond data from a single study and involves consideration magnitude of association, consistency of findings from other studies, examination of dose-response patterns and biologic credibility.
Purposes Of Epidemiology(Gordis: Epidemiology, p. 3-4) • Identify causes and risk factors for disease. • Determine the extent of disease in the community. • Study natural history and prognosis of disease. • Evaluate preventive and therapeutic measures • Provide foundation for public policy
Differences Between Laboratory Sciences And Field Sciences In the Laboratory: • Mostly experimental • Variables controlled by the investigator • All variables known • Replication easy • Results valid • Meaning of results for humans uncertain. • Little need for statistical manipulation of data. • Highly equipment intensive
Differences Between Laboratory Sciences And Field Sciences In the Field: • Mostly observational • Variables controlled by nature • Some variables unknown • Replication difficult; exact replication impossible • Results often uncertain • Meaning of results for humans clear • Statistical control often very important • Highly labor intensive
Descriptive Epidemiology & Measures of Association
Descriptive Epidemiology • Between 2/1/1981 and 5/30/1981 a total of 65 single young men between the ages of 20 – 45 years residing in large metropolitan cities of NY, San Fransisco and Atlanta presented to emergency rooms severely ill. Most were febrile, anemic, severely emaciated with extensive bodily rash. Fevers were not responsive to antibiotic therapy and closer examination revealed the presence of a very rare immune-suppression only observed in undeveloped immune systems (babies) and chemotherapy patients. None of the patients knew each other.
Measures of Disease Frequency • Prevalence (P): status of a given disease in a population or the proportion of disease at a given point in time – a.k.a point prevalence. • Does not distinguish between old and new cases of disease – i.e. cumulative at any point in time. • P = # of cases of disease/total population
Example 1. Among 1000 recruits on an army training camp, 150 were allergic to dairy products and were placed on a modified diet. • The prevalence of dairy allergy = 150/1000 = 15%
Incidence • The number of new cases or events of disease that develop in a population of individuals at risk during a specified time interval. • Provides estimate of the probability that an individual will develop a disease during a specified period of time. I = # new disease cases/total pop’n at risk.
Example 2. Over the one year training camp, another 50 recruits developed the same allergy. (Recall: total sample = 1000 and 150 had allergy to begin with). • The incidence of allergy = New allergy/total at risk for allergy. • = 50 / (1000-150) = 50/850 = 1/13
Measures of Association • A single summary parameter (relative risk or odds ratio) that estimates the correlation between an exposure and the risk of developing a disease. • Accomplished by calculating the ratio of the measures of disease frequency for the exposed group relative to the control (unexposed) group. • This will indicate how much more likely one group is to develop a disease than the other or the difference in disease prevalence between the two groups.
Relative Risk • Relative Risk: estimates the magnitude of association between exposure and disease and indicates the likelihood of developing disease in the exposed group relative to the unexposed group. • It is defined as the ratio of incidence of a disease in the exposed group divided by the ratio of incidence of disease in the unexposed group.
Example: Relative Risk The relative risk is a ratio of two risks. Assume that among the 100 people at risk, 50 are men and 50 women. If 15 men and 5 women develop influenza: • Estimate the risk of developing influenza in men • The risk of developing influenza in women • then the relative risk of developing influenza in men, as compared with women
Odds Ratio • The odds ratio is another measure of association commonly used in certain types of epidemiologic studies to estimate the ratio of odds of exposure among the cases to that among the controls.
Example: Odds Ratio The odds ratio is a ratio of two odds The odds in men = 15/35 divided by The odds in women = 5/45 15/35 : 5/45 = 3.9 We conclude that the odds of men getting influenza over the year are 3.9 times as high as the odds of women getting influenza.
Class Exercise: Hookworm Infection and Anemia in school-age children • C). The relative risk of anemia among hookworm infected children relative to hookworm free children. • D) The odds of anemia among hookworm infected relative to hookworm free children. • Prevalence of hookworm • Infection • b. Prevalence of Anemia: • i) In entire sample • Among hookworm infected • Hookworm free children