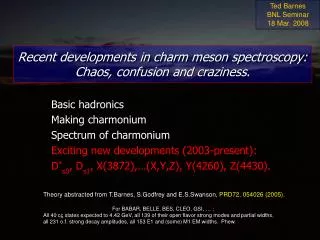
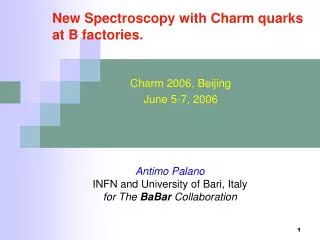
Trend in Charm Spectroscopy
This summary presents the latest developments in charm spectroscopy, with a focus on the properties of charmed baryons, X, Y, and Z states, and the measurement of spins. Highlighting significant findings from the BABAR experiment at PEP-II, the discussion includes the dynamics of charm quark interactions, the emergence of new charmonium-like states, and the implications for understanding QCD. The analysis covers decay modes, measurement techniques, and the challenges of resonance production. An overview of key particles and their characteristics is provided, shedding light on the evolving landscape of hadronic physics.

Trend in Charm Spectroscopy
E N D
Presentation Transcript
Trend in Charm Spectroscopy • A Recap of particles • An Intro • DsJ Spectroscopy • X,Y,Z states • Charmed baryons • Measurement of Spins • D0-D0 Mixing • Summary and Conclusion byUsha Mallik (The University of Iowa)
e+ e- hadrons R = e+ e-μ+μ- 3 generations of quarks, & leptons Quarks, leptons spin 1/2 e+e- qq , l+l- These quarks immediately ‘Dress-up’ as Hadrons by strong interactions (QCD)
Continuum and Resonance Production • cc Hidden charm R bb
b b B e+e- (4S) BB , also cc, ss, uu, dd q (4S) (10580) MeV q B b b e+e- (bb) 1.05 nb (cc) 1.30 nb (uds) 2.09 nb What happens at BABAR e- beam energy9.1 GeV, e+ beam energy 3 GeV, E(cm) = 10.58 GeV (5279MeV) time
OZI Suppression in Decays b q X q (1S) (9460) MeV q X q b time Since (1S) is below B meson pair production threshold, the original b quarks can not be present in the final state: causing the decay rate slower, ie,the lifetime of (1S) longer, and the resonance narrow.
The “Periodic Table” of Hadrons Gell-Mann’s Eight-fold Way : Originally in the 1960’s with only u, d, s quarks: meson qq{q u, d, s ; q u, d, s } 3 3 = 1 8 J = ½ + ½ = 0 J = ½ + ½ = 1 JP = 0- , Pseudoscalar nonet with ' JP = 1- , Vector nonet
With u, d, s, c quarks, the picture gets richer JP = 0- , Pseudoscalar nonet and c JP = 1- , Vector nonet and J/
The BABAR Detector at PEP-II and the Dataset Ecm = 10.58 GeV And Much More Peak luminosity > 1.2 x 1034 cm-2 s-1; Delivered luminosity > 425 fb-1
Charm-strange mesons (cs) : Ds, DsJ With 400 fb-1 data, over 1 billion charmed hadrons produced
States prior to 2003 But for 2573: 2+ not established DSJ(2317)+ = 2319.6 ± 0.2 ± 1.4 MeV/c2 DSJ(2460)+ = 2460.2 ± 0.2 ± 0.8 MeV/c2 Also observed in B-decays Ground State DS(1969)+: JP=0-, c and s spins opposite, in S-wave Observed States DSJ(2317)+ and DSJ(2460)+ observed in Spin-Parity Established
(2006) x 103 x 103 x 103 1 (fits better with a Gaussian, rather than BW)
Yield =182 30 Mass ( MeV/c2): 2715+11-14 Width (MeV/c2): 11520+36-32
NEXT: The New Charmonia ! The Alphabet Soup !
The Charmonium(-like) States Below DD threshold states well understood. The X,Y,Z states are all above the threshold
While searching for BABAR finds new state Y(4260) Not seen in DD
NEXT The Status of Charmed Baryons
Baryon Decuplet Baryon Octet (ddd) (uuu) (uud) (udd) (uds) (uus) (dds) (sss) (uss) (dss) J = ½+ ½ + ½ = 3/2 J = ½ + ½ + ½ = ½ Baryons 333 = 188’10 baryon qqq, anti-baryon qqq
Baryons with 4 flavors (u,d,s,c) 444 = 4 20’20’20 1/2+ 3/2+ Ground states * u,d,s, octet Anti-symmetric Ground state 1/2- u,d,s, decuplet All 9 ground states with JP = ½ observed 5 ground states with JP = 3/2 observed: only c* was missing
The singly charmed u,d,c sub-multiplets from the 20’ 9 members; JP = 1/2 3 (2285) 6 (2472) (2574) (2466) (2579) (2698) c0 - + c+ -+ + c0 - 0- + p- 0K- -+0 -+0 -+-+ -K-++ -K+ About charmed baryons Anti-symm under the interchange of the two light quarks (u,d,s) symm. under the interchange of the two light quarks (u,d,s) Example Decays:
e+e- cc e+e- BB Charm Baryon production Charm baryon or anti charm baryon + X Charm baryon lifetimes are small, even though weak decays b c, and c s are weak decays, ~10-13 s lifetime Weak Decays of -,- and 0 take ~ 1,000 times longer
Observation of Λc(2880)+ and Λc(2940)+ decaying to D0p BaBar PRL 98:012001(2007) Λc(2940) New Decay mode: Λc(2880)+ D0p First observation of charm baryon charm meson Λc(2880) Nsig=2280310 Belle confirms in c (c) Belle Hep-ex/0608043 Λc(2765) Λc(2880) Wrong sign D0P Λc(2940) D0p invariant mass GeV/c2 D0 mass sidebands M(ΛC + -) GeV/c2 Excellent agreement in mass and width
New charm strange baryons BaBar confirms these states cx(3077)+ cx(2970)+ Belle, PRL97:162001(2006) BaBar hep-ex/0607042
c0Production and Decay c0 Decay PDG values
c0Production in B decays hep-ex/0703030, submitted to PRL From B decays Continnum production p* distribution, momentum in the e+e- rest frame Off-peak data: Below B-pair thres-hold, no peak
BaBar PRL 231 fb-1 97:232001(2006) Discovery of the C* Data from all four c0 decay modes are combined and fit yields: 105 21 6 5.2 signal significance No signal found in the c0 mass Sidebands (hatched area) m ( mc* - mc0)= (70.8 1.0 1.1) MeV/c2 Theory range: m = 50 – 94 MeV/c2 = 1.01 0.23 0.11 Combined For XP > 0.5, most/all the c0 may results from c* production, but uncertainty is large.
Study of b → ccs decay BABAR, PRL. 95 142003, 2005 Inconsistency in the MC and data p* distribution: MC only has b → cud Search B decays into charm-baryon-anti-charm-baryon pair B → cc and B → c c K
B decays to cc and c cK Anexample E = energy difference between reconstructed B and Ecm mES : beam momentum substituted reconstructed B mass: e+e- BB
B decays to cc PRD 74 (2006) 111105
B decays to c cK PRL 97 (2006) 202003
NEXT Spin Measurements
L K+ (p+) W- Xc0 = 0 (Wc0 = 0) W- = 0 K- Examine implications of W- spin hypotheses for angular distribution of L from W- decay λ(L) = ± 1/2 q quantization axis λ(K) = 0 J = 1/2 m = + 1/2 m = - 1/2 λ(K) = 0 l(W) = + 1/2 l(W) = - 1/2 W- inherits the spin projections of the Xc0 since, no orbital angular momentum projection w.r.t. quantization axis in Ξc0 decay diagonal density matrix element for W- spin projection li = l(W) is rl i • Initial helicity,λi = λ(W)= ± 1/2 • Final state helicity, λf = λ(L) - λ(pseudoscalar) = ± 1/2 • Decay amplitude for Ω- → Λ K-: Transition matrix element does not depend on li [Wigner-Eckart theorem] Total Intensity: density matrix element for W- spin projection li = density matrix element for charm baryon parent
Spin measurement ofW-fromXc0 → W- K+, W- → L K- decays Data ~ 116 fb-1 Background-Subtracted Efficiency-Corrected PRL 97 (2006) 112001 Similar conclusion fromWc0 → W-p+, W- → LK-decays Conclusion:J(W-) = 3/2 [assumingJ(Xc0) = 1/2] JW = 1/2 → Fit Prob = 10-17 JW = 3/2 → Fit Prob = 0.64 → Fit Prob = 10-7 JW = 5/2 JW ≥ 7/2also excluded: angular distribution increases more steeply near cosq ~ ±1 and has (2 JW -2) turning points. 8
NEXT D0 – D0 Mixing
Example: Mixing One of the main HEP discoveries in 2006: Bs Oscillations Bs0 oscillate very rapidly x=24.8 y~0.1? Rate first measured in 2006 by CDF and D0 Toy MC
Time-Evolution of D0 → K+ π− D0 can reach the K+ - final state in two ways: 1) Doubly-Cabibbo-Suppressed decay 2) Mixing to D0bar, followed by Cabibbo-Favoured decay ... and interference between them. Q: How can we distinguish these? A: By the time evolution.
Fit to signal & sideband regions Plot above shows just signal region: 1.843<m<1.883 GeV/c2 0.1445<Δm< 0.1465 GeV/c2 WS decay time, signal region data - no mix PDF mix - no mix PDF RD: (3.03±0.16±0.10)x10-3 x’2: (-0.22±0.30±0.21)x10-3 y’: (9.7±4.4±3.1)x10-3 Best fit x'2, y' correlation: -0.94 1σ 2σ Fit is inconsistent with no-mixing at 3.9 3σ 4σ No mixing 5σ Contours include statistical & systematic errors Fit Results Evidence for D0-D0 mixing!
Many validation tests done Most powerful is performing a time-independent fit of the Wrong-Sign and Right-Sign yields in slices of proper lifetime: Consistent with prediction from full likelihood fit ||2=1.5 (stat. only) Inconsistent with no-mixing hypothesis ||2=24 Ratio of WS/RS events clearly increase with time. Mixing signal!
Summary • A new landscape in many areas including spectroscopy has opened up with high luminosity and precision • New DsJ Spectroscopy • X, Y, Z States • Charmed Baryon Spectroscopy • Spin Measurements (necessary to identify levels, complex analysis for multi-body states: c (1530), c (1690), in Charmed Baryon decays ) • D0-D0 Mixing Observed Expecting ~three/four times more data than shown in analyses A race to find Beyond Standard Model Physics