Download
1 / 22
220 likes | 329 Vues
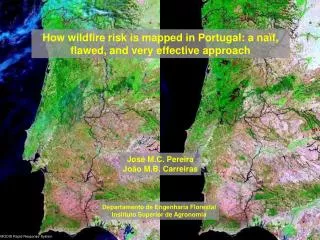
How wildfire risk is mapped in Portugal: a naïf, flawed, and very effective approach. José M.C. Pereira João M.B. Carreiras. Departamento de Engenharia Florestal Instituto Superior de Agronomia. MODIS Rapid Response System. Nº fires / 100ha. Burned area density.

E N D
How wildfire risk is mapped in Portugal: a naïf, flawed, and very effective approach José M.C. Pereira João M.B. Carreiras Departamento de Engenharia Florestal Instituto Superior de Agronomia MODIS Rapid Response System
Nº fires / 100ha Burned area density Number of fires and area burned in southern Europe, 1980 – 2004, per unit area (European Commission, 2005) BACKGROUND Nº fires Area burned Number of fires and area burned in southern Europe, 1980 – 2004, absolute values (European Commission, 2005)
BACKGROUND 1997 - 2005 Night-time hotspots detected with the Along Track Scanning Radiometer, onboard the European Remote Sensing Satellite.
BACKGROUND All fires > 5ha mapped from Landsat satellite imagery. About 35000 fires, during the period 1975 – 2005. Kernel density interpolation of burned area marked point data, using 25 nearest neighbors, Gaussian kernel, and 1km2 grid.
Fire risk mapping • Fire risk map developed by request of the Portuguese Forest Service, to replace outdated map, from the late 1970s. • Map is used to support decisions dealing with location / allocation of fire-fighting manpower and equipment, routing ground patrols, prioritise afforestation / reforestation projects. • Why not simply use historical fires map (previous slide) to characterise risk?
Fire risk mapping • There are areas that never burned during the study period, but which have environmental characteristics similar to those that did burn. They are high risk areas that need to be identified and mapped. • Once an area burns, it takes a few years for vegetation to regrow, so that the area can burn again. • An area may be very fire prone, in the long run perspective. But, in the short run, it is unlikely to burn because it lacks fuel.
Fire risk mapping - Our approach: • Model long-term (10-year) spatial fire pattern with regression tree, using KD-interpolated fire map as dependent variable and slow-changing environmental factors (climate, topography, and population) as independent variables. • Model rapid fuel availability dynamics as a function of time (years) since last fire. • Model fast-changing relationship between plant moisture status and fire incidence, using late Spring satellite imagery.
Area burned, 1995 - 2004 Fire perimeters mapped from Landasat satellite imagery,with a pixel size of 30m. The area burned in this period is approximately 1.500.000 ha (17% of the total area of Portugal).
Burning probability over a 30 year period • Centroids of fire perimeters (1995-2004). • Points marked with area value. • Kernel density interpolation to 1km2 grid. Proportion of area burned (1995 – 2004), in each grid cell: P = 1 – (1 – 1/b)n, P - Probability of burning, over a period of n years, in each grid cell. b – Fire cycle: time required for burning 100ha in a grid cell.
Slope (%) Population density (inhab/km2)
# days Tmax > 25 ºC # days P > 1mm (May-Sept)
Fire risk – Slow variables Definition of 5 risk classes: Very low: P < 0.10 Low: 0.10 < P < 0.20 Medium: 0.20 < P < 0.30 High: 0.30 < P < 0.49 Very high: P > 0.49
Fire risk – NDVI • Fire incidence over pre-fire values of the normalized difference vegetation index, from Terra/Aqua MODIS images 2000-2004. • Fitted Weibull distribution: mean value of 0.599 and standard deviation of 0.102. • Definition of 5 risk classes, centred on the mean value of the Weibull distribution: Very low: µ ± 2.5 s Low: µ ± 2.0 s Medium: µ ± 1.5 s High: µ ± 1.0 s Very high: µ ± 0.5 s
Area burned 1990-2004: calculation of the # years since last fire. • CLC2000 (+ fogos 2000-2004): classes de ocupação do solo. • Post-fire fuel accumulation curve (for shrublands): B = 31.6614 (1 – e –0.0917t), B – biomass (t/ha), t – time (years) - Definition of 5 risk classes associated with fuel accumulation): Very low: B < 5 t/ha Low: 5 < B < 10 t/ha Medium: 10 < B < 15 t/ha Low: 15 < B < 20 t/ha Very low: B > 20 t/ha Fire risk – Fuel accumulation
Fire risk – NDVI x Fuel accumulation • Two-way table and map combining NDVI class and post-fire fuel accumulation class. • Integrates fuel quantity and moisture status. Represents “fast” vegetation variables.
Fire risk – Slow x Fast variables • Two-way table and map combining the slow variables (slope, climate, population) and the fast vegetation variables.
Fire risk & area burned Validation • Calculation of relative fire incidence: RI =
Fire perimeters County borders
This was a “quick-and-dirty” approach, combining previously existing datasets, and methodologies we were familiar with. • We want to improve it, make it more rigorous. We’d like to represent both fast and slow risk components in a probabilistic framework, eliminating the need for the two-way tables to combine incommensurate datasets. • The concept of a slow risk component, excluding the vegetation factor, and a fast risk component, representing vegetation dynamics (fuel depletion / regrowth) is valuable and should be kept. • Formal improvement should not reduce effectiveness of the results.
Acknowledgements: • The Wildifre Risk Map for 2005 was developed at the Departamento de Engenharia Florestal (DEF), Instituto Superior de Agronomia (ISA), in collaboration with the Direcção-Geral dos Recursos Florestais (DGRF), and funded by COTEC Portugal - Associação Empresarial para a Inovação, under the Forest Fires Initiative.