Download
1 / 47
480 likes | 887 Vues
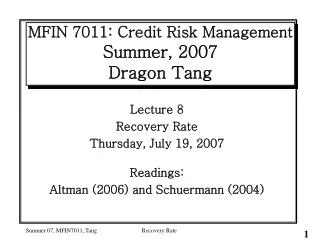
Lecture 16 Credit Value-at-Risk II Tuesday, July 31, 2007 Readings: Credit Metrics Technical Documents http://www.riskmetrics.com/techdoc.html. MFIN 7011: Credit Risk Management Summer, 2007 Dragon Tang. Credit Value-at-Risk II. Objectives : CreditMetrics’s method.

E N D
Lecture 16 Credit Value-at-Risk II Tuesday, July 31, 2007 Readings: CreditMetrics Technical Documents http://www.riskmetrics.com/techdoc.html MFIN 7011: Credit Risk ManagementSummer, 2007Dragon Tang Credit VaR II
Credit Value-at-Risk II • Objectives: • CreditMetrics’s method Credit VaR II
CreditMetrics model is a model for Credit VaR Analogous to Market VaR, Credit VaR answers the following type of question: How much of the credit loss are we 99% certain that will not be exceeded in 1 year? CreditMetrics is a full blown Monte Carlo simulation model which could take a lot of real life complications into consideration Simulation is known to be slow Simulation-based Credit VaR model is the only way to model counterparty risk accurately Introduction Credit VaR II
Market vs. Credit Return Distribution Credit VaR II
Credit return distribution can not be approximated with a normal distribution Data is much more of an issue than in market risk Model is more complex, simulation is often the only solution (larger model risk) Difficulties Credit VaR II
CreditMetrics Stand-Alone Credit Risk Credit VaR II
Credit Migration Source: Riskmetrics, “CreditMetrics Technical Document”, 1997 Credit VaR II
Migration Matrix Source: Riskmetrics, “CreditMetrics Technical Document”, 1997 Credit VaR II
Valuation in Default State Source: Riskmetrics, “CreditMetrics Technical Document”, 1997 Credit VaR II
Valuation in Nondefault States Source: Riskmetrics, “CreditMetrics Technical Document”, 1997 Credit VaR II
Use the data in the previous slides, calculate the expected price of a 5-year 7% annual-paid subordinated BBB-bond (with $100 face) in one year time Exercise Credit VaR II
Standard deviation Sample standard deviation can be calculated As credit return distribution is asymmetric, interpreting standard deviation is difficult Percentile Level Also known as Credit VaR Same interpretation as VaR Different Credit Risk Measures Credit VaR II
Calculate the standard deviation for the BBB-bond What is the 99th-percentile? Exercise (Cont.) Credit VaR II
CreditMetrics Portfolio Credit Risk Credit VaR II
BBB Bond Source: Riskmetrics, “CreditMetrics Technical Document”, 1997 Credit VaR II
BBB Bond Source: Riskmetrics, “CreditMetrics Technical Document”, 1997 Credit VaR II
BBB Bond Source: Riskmetrics, “CreditMetrics Technical Document”, 1997 Credit VaR II
BBB Bond Source: Riskmetrics, “CreditMetrics Technical Document”, 1997 Credit VaR II
A Bond Source: Riskmetrics, “CreditMetrics Technical Document”, 1997 Credit VaR II
A Bond Source: Riskmetrics, “CreditMetrics Technical Document”, 1997 Credit VaR II
BBB and A Bonds Source: Riskmetrics, “CreditMetrics Technical Document”, 1997 Credit VaR II
Zero Correlation Source: Riskmetrics, “CreditMetrics Technical Document”, 1997 Credit VaR II
Asset Value Source: Riskmetrics, “CreditMetrics Technical Document”, 1997 Credit VaR II
Asset Value T(AA) T(B) T(Default) Source: Riskmetrics, “CreditMetrics Technical Document”, 1997 Credit VaR II
The value of a firm is assumed to be log-normally distributed, that is The log of the value is normally distributed Or, the rate of return is normally distributed For simplicity, CreditMetrics advocates to assume the expected return to be zero, which seems to be harmless Asset volatility is embedded in the rating, and does not have other explicit effects Asset Allocation Credit VaR II
Exercise • Complete this table with the threshold values for up- and down-grading from a BBB firm • Interpretation: Next year’s credit rating for a given firm can be simulated using a (standard) normal random variable Credit VaR II
Asset correlation can be approximated with equity correlation, ignoring the difference between asset and equity A typical bank would have thousands of obligors, many of which would not be publicly traded To remedy the lack of data, CreditMetrics uses a factor model for the asset correlation between all obligors The factors are country and industry groupings The analysis is very data intensive The method of CreditMetrics is related to those used by KMV’s Global Correlation Model Asset Correlation Credit VaR II
In the case of two obligors in a portfolio, asset correlation is essential in calculating the joint probabilities. E.g. the joint probability of a BB firm and an A firm to remain in their current credit ratings is given by By mapping to a bivariate-normal distribution, we can compute the table on the next slide Asset Correlation Credit VaR II
Asset Correlation Source: Riskmetrics, “CreditMetrics Technical Document”, 1997 Credit VaR II
Portfolio of Two Bonds Source: Riskmetrics, “CreditMetrics Technical Document”, 1997 Credit VaR II
The analytic approach presented here is inconvenient when there are many assets. For instance, there are 8*8*8 = 512 possible joint rating states for a three assets portfolio. And 8N states for an N assets portfolio For large portfolio, we are using Monte Carlo simulation approach The theory of multivariate-normal distribution is well-developed; it is also implemented in many software packages Curse of Dimension Credit VaR II
CreditMetrics Recovery Rate Credit VaR II
Recovery rate, i.e. 1-LGD, is stochastic and has a continuous distribution over interval [0,1] Recovery Rate Source: Riskmetrics, “CreditMetrics Technical Document”, 1997 Credit VaR II
CreditMetrics uses beta distribution for modeling recovery rate Beta distribution is a continuous distribution defined over the interval [0,1] There are two parameters a and b, which define the mean and variance as: Beta Distribution Credit VaR II
If we know the mean and variance {m,v}, we can completely define the Beta distribution with Beta Distribution Credit VaR II
CreditMetrics Simulations Credit VaR II
Apply the Central Limit Theorem (CLT) Sample mean of size n is normally distributed, with mean being the true mean of the population, and standard error σ/√n σ is sample standard deviation Confidence Interval - Mean Credit VaR II
Sample standard deviation is also normally distributed, with standard error estimated by breaking the total sample into groups For instance, there are 10,000 portfolio scenarios, which can be divided into 50 non-overlapping groups of 200. We can calculate the sample standard deviation within each group. The sample standard deviation of these sample standard deviation estimates, s, is the standard error for the sample standard deviation with size 200. The standard error for sample standard deviation of size 10,000 equals s/√50, This procedure is known as “jackknifing” Confidence Interval – Std Dev Credit VaR II
In a 10,000 runs of simulation, the expected number of portfolio values smaller than the 99th-percentile, N99%, is 9900, while the standard deviation for this binomial distribution is Confidence Interval - VaR Credit VaR II
We can apply the CLT for this many trials. It is reasonable to approximate the distribution of the N99% by the normal distribution. Thus, there are 95% chance that N99% will be between 9900-1.96*9.95 and 9900+1.96*9.95, i.e. 9880.5 and 9919.5 For a slightly higher chance N99% is between 9880 and 9920 Once the list of simulated future P&L values is sorted from high to low, the 95% confident interval for the 99th-percentile is given by the values at positions 9880 and 9920 Confidence Interval - VaR Credit VaR II
CreditMetrics Portfolio Context Credit VaR II
CreditMetrics defines marginal standard deviation as the portfolio standard deviation increase due to the inclusion of a transaction Similarly, the incremental VaR is defined as the portfolio VaR increase due to the inclusion of a transaction So, the marginal measures are defined in CreditMetrics in a discrete sense, instead of the usual infinitesimal sense Marginal measures show the risk contribution of an individual transaction within a portfolio Marginal Measures Credit VaR II
Sample Bond Portfolio Credit VaR II
Marginal Standard Deviation Percentage of Market Value Credit VaR II
Exposure vs. Marginal Measures Market value Credit VaR II
Typical Credit Portfolio Credit VaR II
Summary • CreditMetrics Credit VaR calculation • Next: Basel II Credit VaR II