Download
1 / 19
190 likes | 326 Vues
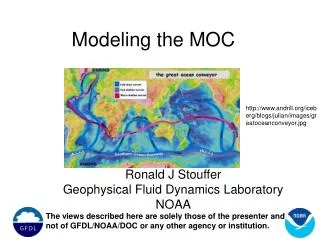
Monitoring of the MOC (MOVE) with T. Kanzow C. Begler M. Lankhorst X. Fan J. Haag. Monitoring of boundary currents (CORC) with R. Davis P. Niiler D. Roemmich B. Cornuelle D. Rudnick J. Haag. The global timeseries system (OceanSITES) with

E N D
Monitoring of the MOC (MOVE) with T. Kanzow C. Begler M. Lankhorst X. Fan J. Haag Monitoring of boundary currents (CORC) with R. Davis P. Niiler D. Roemmich B. Cornuelle D. Rudnick J. Haag The global timeseries system (OceanSITES) with R. Weller and the OceanSITES Teams Uwe Send Scripps Institution of Oceanography
MOVE (Meridional Overturning Variability Experiment): • Cost-effective concept to • monitor transport of • southward NADW between • western boundary and • Mid-Atlantic Ridge • Assumptions: • Balances northwardthermocline transport(mass balance) • Little transport east of MAR(reasonable based onCFC and model data,since 2006 full-basin coverage with German mooring in east) Southward limb of MOC MOVE array
Initial array design (with added moorings from M.McCartney GAGE) Integrate NADW flow over 1000km with “geostrophic” end-point moorings NADW “Geostrophic” Moorings • Started in 2000 as German CLIVAR project, now fully NOAA funded. • have demonstrated the accuracy • learned how to achieve same with sparse array (2 moorings + epsilon) • 8 ½ years of data now, 97% data return on internal and boundary transport
NADW geostrophic transport rel. 4950db, and slope transport from current meters (large variability due to Rossby waves) Absolute internal plus boundary transport (mean = -14.9Sv)
The timeseries is about to become long enough now to establish a trend… 40 degrees of freedom, suggested transport decrease 3Sv/10years (very similar to Bryden et al 2005) The transport timeseries has a significant decreasing trend with 80% certainty. (Still need to test bias due to choice of reference level and due to lacking eastern basin component)
Lessons: • Have a large knowledge base now how to make such measurements accurately and efficiently • Barotropic (reference pressure) transports currently have trend removed, nowstaggered/overlapping 4-year pressure timeseries are being collected • Array now extended across entire Atlantic, expected to reduce Rossby-wavenoise more reliable transport estimates • Outlook: • the timeseries will allow to establish an MOC trend at 16°N within a few years • merging observations from several latitudes (MOVE and RAPID) mayallow to isolate local vs. large-scale changes • lessons/experience for MOC and boundary current monitoring at other places
Boundary Current monitoring Most of these current systems are not covered at present... CORC project: develop and test methodologies for sustained and real-time boundary current observations (2 years completed now)
Existing SINGLE approaches fail in boundary currents: • ARGO and surface drifter density is too sparse in narrow and swift currents • XBT’s do not reach deep enough, miss salinity contribution, and sometimes are too manpower intensive (e.g. Gulf Stream), may alias transport • end point moorings (as in MOVE) may capture mass transport but cannot resolve heat transport, are expensive and require annual turn if surface moored, miss non-geostrophic parts • gliders are too slow (see Kessler presentation), not deep enough • CORC objective: • Find optimal integration of above techniques to exploit their respective strengths
CORC components currently being implemented/tested: 1) End-point moorings with bottom pressure High temporal resolution of horizontal integral (geostrophic MASS transport), full depth 2) Underwater gliders High horizontal resolution of 0-1500m heat and average flow, every 1-2 weeks 3) Inverted echosounders plus bottom pressure Limited horizontal sampling of 2 vertical integrals with good time resolution pbot = g (z) dz = dz/c(z) 4) Data telemetry / near-real time products Gliders as data relay for subsurface instruments.... 5) Additional elements: - Surface drifters for non-geostrophic flow, merging with ARGO and XBT data - Assimilation of integrated data sets together with altimetry and wind forcing
(F.Bryan et al) Example sketch for Gulf Stream: • Moorings: • determine net mass transport, including eddies, recirculations,... • For heat transport need • vT dx dz : Gliders: provide regular upper layer T-weighting of v distribution in stream coordinates • IES+pressure: • when upper-layer flow and heat content is know, this provides lower-layer correlation of v and T.
Possible, cost-effective configuration : Example: total 4 gliders, 2 at the end points, 2 on a 500km section 1 trip each 2 weeks
Initial implementation across the California Current (later in Solomon Sea, see Kessler presentation) • Current status: • test mooring and IES near San Diego • 1 glider with modem incorporated • 2 short test glider missions • downloaded 1 year of daily IES data • 2 more gliders under construction • auto-release drifters under construction • 2 end point moorings, 5 IES to be deployed across California Current in Sep’08 (trial phase) • full deployment (less sparse) Sep’09
CORC Summary: develop a capacity and start to routinely observe climate signatures in boundary currents • Technology developments • mooring and IES communication with gliders • autonomous glider underwater acoustic navigation • programmed releases of “parked“ surface drifters • tests of 2000m XBTs • Methodological • merge and exploit strengths of individual observing techniques • “connect“ to interior observing system • test consistency/redundancy/accuracy of single elements • assimilation of in-situ data, altimetry, winds, large-scale data to refine relevant quantities • Climate applications • interannual and decadal changes in the California Current • relate circulation changes to climate phenomena • impact on ecosystem and mechanisms (advection, propagation, local forcing) • monitor source of EUC for variability in heat transport • Sustained operation • develop cost-effective procedures and operating facilities • routine production of indices for circulation system
… a global network of FIXED open-ocean sites, which • collect timeseries of atmospheric, physical, biogeochemical, or ecosystem variables • are sustained or planned to be sustained • use mooring or ship-board (min. monthly) or cable or glider observations • share data freely and in real-time/with minimum delay • want to cooperate to be part of the network
Recent OceanSITES developments and current activities • A) Assure data are useful and used by providing easy access • 2 GDAC’s now exist and cooperate: Coriolis/France and NDBC/USA • national/regional DAC’s have been defined and their roles agreed • a unified data format (NetCDF) is under revision and test • data from 12 timeseries site operators will flow routinely within 12 months, from ONE place in ONE format • 2 working groups established to agree on unified QC and best practices
B) Develop/provide products to a variety of users via www.oceanSITES.org, e.g. • air-sea flux data from all flux sites for model validation • 15m currents for validation of drifter and satellite current products • sea surface salinities for remote sensing validation • wave data measured by surface moorings for wave products/validation • column integrated chlorophyll estimates for remote sensing/model validation • more…. • C) Provide global ocean timeseries indicators on www.oceanSITES.org, e.g. • pCO2 and pH from all the sites in the network measuring this • boundary current transports • assembled heat and freshwater content timeseries • eddy energy timeseries where available • geostrophic transports between pairs measuring dynamic height • work towards ocean acidification and ecosystem indices
D) Make sites more similar and measurements more comparable • Minimum set of sensors to have global impact for all disciplines: • met sensors • Surface T/S and thermistors for mixed-layer depth resolution • 0-1500m T/S sensors for dynamic height transport estimates • Near-surface currents, minimum one at 15m • Surface pCO2 for flux calculations • Dissolved O2 at 5 depths for productivity and gas exchange estimates (with PCO2) • Nitrate at 2 depths for mechanisms of forcing/limitation • Downwelling radiometer at 20-30m and at surface for total biomass estimates Choose 10-20 sites that can be enhanced by adding some/all above sensors Typical cost: 200k$ per site… need about 2Mio$ to make (initial) quantum leap
Strawman set of sites that have the potential to become a truly integrated core timeseries system USA Europe Japan Australia India OceanSITES DART
Activities in the future facilitated by: 1) Re-invigorated Steering and Data Management Committees 2) Project Office support (started and 50% funded by NOAA) at JCOMMOPS 3) OceanSITES now is an official component of the global ocean observing system, part of JCOMM, and a pilot project of the Data Buoy Coordination Panel (DBCP). www.oceanSITES.org