Download
1 / 41
410 likes | 529 Vues
This review outlines the essential concepts of statistical inference concerning population means. It covers point estimation, including the calculation of the estimated standard error, and interval estimation for large sample sizes, using confidence intervals. The review also details the five steps of hypothesis testing, encompassing the formulation of alternative hypotheses and P-value calculations. Additionally, it discusses methods for testing differences between two means using independent and paired samples, incorporating practical examples and real-world applications in economics and education.

E N D
Ch7 Inference concerning means II Dr. Deshi Ye yedeshi@zju.edu.cn
Review • Point estimation: calculate the estimated standard error to accompany the point estimate of a population. • Interval estimation whatever the population, when the sample size is large, calculate the 100(1-a)% confidence interval for the mean When the population is normal, calculate the 100(1-a)% confidence interval for the mean Where is the obtained from t-distribution with n-1 degrees of freedom.
Review con. • Test of Hypothesis 5 steps totally. Formulate the assertion that the experiment seeks to confirm as the alternative hypothesis • P-value calculation the smallest fixed level at which the null hypothesis can be rejected.
Outline • Inference concerning two means • Design Issues – Randomization and Pairing
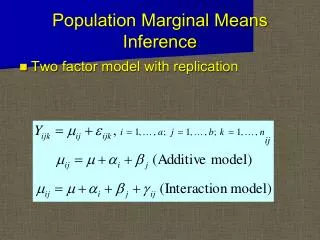
7.8 Inference concerning two means • In many statistical problems, we are faced with decision about the relative size of the means of two or more populations. • Tests concerning the difference between two means • Consider two populations having the mean and and the variances of and and we want to test null hypothesis Random samples of size
Two Populations Paired Mean Proportion Variance Indep. Z Test t Test t Test Z Test F Test (Large (Small (Paired sample) sample) sample) Two Population Tests
Testing Two Means Independent Sampling& Paired Difference Experiments
Independent & Related Populations Independent Related
1. Different Data Sources Unrelated Independent Independent & Related Populations Independent Related
1. Different Data Sources Unrelated Independent 1. Same Data Source Paired or Matched Repeated Measures(Before/After) Independent & Related Populations Independent Related
1. Different Data Sources Unrelated Independent 2. Use Difference Between the 2 Sample Means X1 -X2 1. Same Data Source Paired or Matched Repeated Measures(Before/After) Independent & Related Populations Independent Related
1. Different Data Sources Unrelated Independent 2. Use Difference Between the 2 Sample Means X1 -X2 1. Same Data Source Paired or Matched Repeated Measures(Before/After) 2. Use Difference Between Each Pair of Observations Di= X1i - X2i Independent & Related Populations Independent Related
Two Independent Populations Examples • 1. An economist wishes to determine whether there is a difference in mean family income for households in 2 socioeconomic groups. • 2. An admissions officer of a small liberal arts college wants to compare the mean SAT scores of applicants educated in rural high schools & in urban high schools.
Two Related Populations Examples • 1. Nike wants to see if there is a difference in durability of 2 sole materials. One type is placed on one shoe, the other type on the other shoe of the same pair. • 2. An analyst for Educational Testing Service wants to compare the mean GMAT scores of students before & after taking a GMAT review course.
Thinking Challenge • 1. Miles per gallon ratings of cars before & after mounting radial tires • 2. The life expectancy of light bulbs made in 2 different factories • 3. Difference in hardness between 2 metals: one contains an alloy, one doesn’t • 4. Tread life of two different motorcycle tires: one on the front, the other on the back Are They Independent or Paired?
Test • The test will depend on the difference between the sample means and if both samples come from normal population with known variances, it can be based on the statistic
Theorem • If the distribution of two independent random variables have the mean and and the variance and , then the distribution of their sum (or difference) has the mean (or ) and the variance Two different sample of size
Statistic for test concerning different between two means Is a random variable having the standard normal distribution. Or large samples
EX. • To test the claim that the resistance of electric wire can be reduced by more than 0.05 ohm by alloying, 32 values obtained for standard wire yielded ohm and ohm , and 32 values obtained for alloyed wire yielded ohm and ohm Question: At the 0.05 level of significance, does this support the claim?
Solution • 1. Null hypothesis: Alternative hypothesis 2. Level of significance: 0.05 3. Criterion: Reject the null hypothesis if Z > 1.645 4. Calculation: 5. The null hypothesis must be rejected. 6. P-value: 1-0.996=0.04 < level of significance
Type II errors • To judge the strength of support for the null hypothesis when it is not rejected. • Check it from Table 8 at the end of the textbook The size of two examples are not equal
Small sample size • 2-sample t test.
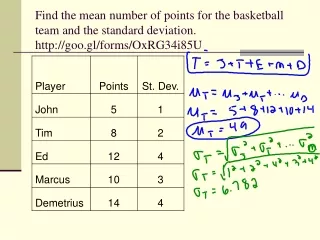
EX • Mine 1 Mine 2 • 8260 7950 • 8130 7890 • 8350 7900 • 8070 8140 • 8340 7920 • 7840 The following random samples are measurements of the heat-producing capacity of specimens of coal from two mines Question: use the 0.01 level of significance to test where the difference between the means of these two samples is significant.
Solution • 1. Null hypothesis: Alternative hypothesis 2. Level of significance: 0.01 • Criterion: Reject the null hypothesis if t > 3.25 or t< -3.25 4. Calculation: 5. The null hypothesis must be rejected. 6. P-value: 0.004 < level of significance 0.01
Output • Two-sample T for Mine 1 vs Mine 2 • SE • N Mean StDev Mean • Mine 1 5 8230 125 56 • Mine 2 6 7940 104 43 • Difference = mu (Mine 1) - mu (Mine 2) • Estimate for difference: 290.000 • 99% CI for difference: (133.418, 446.582) • T-Test of difference = 0 (vs not =): T-Value = 4.19 P-Value = 0.02 DF = 9
SE mean: (standard error of mean) is calculated by dividing the standard deviation by the square root of n. • StDev: standard deviation .
Confidence interval • 100(1-a)% confidence interval for Where is based on degrees of freedom.
Matched pairs comparisons • Question: Are the samples independent in the application of the two sample t test? • For instance, the test cannot be used when we deal with “before and after” data, where the data are naturally paired. • EX: A manufacturer is concerned about the loss of weight of ceramic parts during a baking step. Let the pair of random variables denote the weight before and weight after baking for the i-th specimen.
Statistical analysis • Considering the difference • This collection of differences is treated as random sample of size n from a population having mean : indicates the means of the two responses are the same Null hypothesis:
EX • The following are the average weekly losses of worker-hours due to accidents in 10-industrial plants before and after a certain safety program was put into operation: • Before 45 73 46 124 33 57 83 34 26 17 • After 36 60 44 119 35 51 77 29 24 11 • Question: Use the 0.05 level of significance to test whether the safety program is effective.
Solution • 1. Null hypothesis: Alternative hypothesis 2. Level of significance: 0.05 3. Criterion: Reject the null hypothesis if t > 1.833 4. Calculation: 5. The null hypothesis must be rejected at level 0.05. 6. P-value: 1-0.9985=0.0015 < level of significance
Confidence interval • A 90% confidence interval for the mean of a paired difference. • Solution: since n=10 difference have the mean 5.2 and standard variance 4.08,
7.9 Design issues: Randomization and Pairing Randomization: of treatments prevents uncontrolled sources of variation from exerting a systematic influence on the response Pairing: according to some variable(s) thought to influence the response will remove the effect of that variable from analysis Randomizing the assignment of treatments within a pair helps prevent any other uncontrolled variables from influencing the responses in a systematic manner.