Ecosystem Modeling of Northern Gulf of Alaska: Simulation and Field Data Comparison
10 likes | 118 Vues
This study compares simulated and measured data from the Northern Gulf of Alaska ecosystem model, analyzing nutrient distribution, primary production, and zooplankton biomass. Results suggest the model can replicate key patterns for the year 2001.

Ecosystem Modeling of Northern Gulf of Alaska: Simulation and Field Data Comparison
E N D
Presentation Transcript
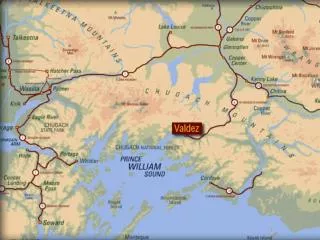
July 2001 Simulated 100 July 80 84 80 60 July 60 40 11 Component Model Slide by G. Gibson 40 80 20 May 20 60 0 0 Measured 1 3 5 7 9 11 13 1 3 5 7 9 11 13 40 60 Hnano Hnano 20 Hdino Hdino August Ciliates Ciliates 50 < 2 µm ROMS >2-10 µm GAK 4 2000-2004 Integrated Productivity 40 0 >10 µm 5 1 3 5 7 9 11 13 30 4 3 gC/m2/day 20 2 10 Seward Line Stations 1 Iron 0 0 3 3 3 3 3 4 4 4 5 5 5 5 5 7 7 7 7 8 8 8 8 10 10 10 12 12 1 3 5 7 9 11 13 GAK 13 2000-2004 Integrated Productivity Month < 2 µm GAK 9 2000-2004 Integrated Productivity 3 3.5 >2-10 µm 3 2.5 2.5 >10 µm gC/m2/day 2 2 1.5 gC/m2/day 1.5 1 0.5 1 GAK 1 2000-2004 Integrated Productivity 0 4 4 8 8 3 3 5 5 5 7 7 10 10 12 0.5 3 Month 0 2.5 3 3 3 4 4 5 5 7 7 8 8 10 12 10 2 Month gC/m2/day 1.5 1 0.5 0 3 4 4 5 5 7 7 8 8 3 3 10 10 10 12 Month Seasonal and Geographic Nutrient Distribution Model must reproduce the timing and peaks suggested from mooring fluorescence data. Mooring data from Stabeno (PMEL) GAK1 GAK4 Mooring Fluorescence Data GAK5 June 2002 – July 2003 The ecosystem model is embedded in a 3-dimensional physical circulation model (ROMS) to link climate forcing to the ecosystem response. Major blooms occur in late April, May or early June with low production in March and early April GAK13 GAK9 Prince William Sound The physical model is run in three dimensions and the data are used to drive a one – dimensional model at each Seward Line station location. Direct comparisons can then be made between GLOBEC field measurements and the model output. Comparisons here are done for the 2001 field season. Knight Island Passage Resurrection Bay Middleton Island Simulated surface nitrate (mM m-3), July 10 Field measurements Simulated and measured primary production for stations GAK 1, 4, 9 and 13. Note that the magnitudes of simulated and measured production are similar but mooring data suggest that production may be more peaked than the simulation indicates. Production measurements by Whitledge and Stockwell (University of Alaska). Comparison of measured and simulated microzooplankton biomass at station GAK6. Magnitudes of simulated and measured biomass are similar. Field data from Lessard (University of Washington) Comparison of measured and simulated mesozooplankton biomass at station GAK6. Total zooplankton biomass (top panel, field data) is similar to simulation. Neocalanus biomass in simulation is high for 2001 Comparison of measured and simulated phytoplankton biomass at station GAK6. Simulated peak biomass occurs in mid April and May with magnitudes similar to field measurement by Lessard (University of Washington). Seward Line Stations Field Data The model was capable of producing the high nitrate concentrations above the seasonal thermocline in the Alaska gyre and nitrate exhaustion typical of the shelf during summer. Photosynthetically active radiation (PAR) in the model was similar to values measured at the ship’s mast head during cruises, but the range of measured values was substantially greater than simulated values. Field Data Simulated and measured nitrate and ammonium on Seward Line. The simulation can reproduce the vertical distribution and approximate magnitude of field measurement. Nutrient data from Whitledge (University of Alaska). Simulated primary production (g C m-2 y-1) SeaWiFS Satellite Chlorophyll May 13 2001 Comparison of simulated primary production and satellite chlorophyll image. Note the elevated primary production and chlorophyll concentration to the west of the Seward Line (arrows) suggesting the model can reproduce physical mechanisms affecting distribution of production on the shelf. Seasonal Zooplankton Biomass Simulation of the Northern Gulf of Alaska Ecosystem Kenneth O. Coyle (SFOS, University of Alaska) Al Herman (NOAA, Seattle), Sarah Hinkley (NOAA Seattle) Funding Agency: North Pacific Research Board Phytoplankton Biomass and Production Model and Site Description Phytoplankton Biomass Conclusions and Perspectives Photosynthetically Active Radiation • Conclusions: • The model as currently parameterized was capable of reproducing broad scale patterns of nutrient concentration, primary production, and biomass of phytoplankton, microzooplankton and mesozooplankton on the northern Gulf of Alaska shelf for 2001. • Remaining Tasks: • Get the physical model to run with tides. • Run the model on the 3 km Gulf of Alaska grid for 2001, 2002, 2003, 2005 and 2006. • Major question: • Can the model reproduce the interannual variability observed in the field data? Distribution of Production