January 14, 2009
170 likes | 255 Vues
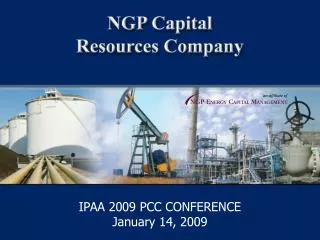
IPAA Private Capital Conference. Conditions in the Energy Capital Markets. Jason T. Meek Managing Director, Corporate Finance RBC Capital Markets. January 14, 2009. Banks. Private Equity. ’ 09 Energy Capital Markets. Conditions in the Energy Capital Markets. Assets . $632 B.

January 14, 2009
E N D
Presentation Transcript
IPAA Private Capital Conference Conditions in the Energy Capital Markets Jason T. Meek Managing Director, Corporate Finance RBC Capital Markets January 14, 2009
Banks Private Equity ’09 Energy Capital Markets Conditions in the Energy Capital Markets
Assets $632 B Credit Rating Aaa / AA- Ranking by Assets in North America #5 Market Cap ~$42 B Assets under Admin. $562 B Employees Worldwide ~80,000 #1 in E&P Equity for 2008 Top Tier A&D Advisor in-house (Richardson Barr) $28 Billion Committed to North American Energy Companies Top-Tier Research (Equity and High Yield) Overview of RBC Capital Markets
RBC Capital Markets Hires from U.S. Rivals to Expand Bloomberg NewsAugust 20, 2008 RBC Hires Again on Credit Crunch Fallout Financial PostJuly 08, 2008 RBC on Top Again Financial PostJanuary 31, 2008 Moody’s Affirms RBC’s Ratings Moody’sMay 30, 2008 Battle for the 'bulge' business; RBC gets paws on global customers National PostSeptember 29, 2008 Emerging Leader in North America RBC has maintained its strong capital position relative to its competitors $61.0 $41.5 $167.6 $96.9 $88.7 $33.2 $84.8 Market cap. (US$bn)(1) $27.9 $127.0 2007 (1/1/07) $239.8 Current (1/9/09) $42.3 $65.2 $85.4 $273.7 $82.3 $20.2 $108.6 Ascending rank by % marketcap lost $41.4 $18.6 $36.8 $0.0 $12.0 • Source Bloomberg and FactSet. Write-downs and equity capital raised based on Q3 2007 to date RBC has demonstrated unique stability during the market dislocation and increased its leadership across investment banking products
Headwinds Tailwinds Energy Capital Markets • E&P stock prices down approximately 52% for the year 2008 • Commodity prices have dropped significantly through the second half of 2008 • Current global recession • Global oil demand expected to decline 0.6% in 2009 • US natural gas demand expected to remain flat for 2009 • Uncertainty of new administration • Volatility of current equity markets • Ongoing credit crunch • Necessity to shore up liquidity position • Decrease in borrowing bases by 15 percent to 20 percent(3) • OPEC is dependent of oil prices around $50.00/bbl to fund domestic programs and capital investments(1) • December production cuts of of 2.2 mmb/d; previous cut of 1.5 mmb/d in October • 2H 09 Forward curve average of ~$56.00/bbl(2) • Tax cuts / economic stimulus package • Institutions on sidelines • E&P companies trading at below average multiples • Ample supply of private equity • Drop in natural gas rig counts should provide near-term price support (1) “OPEC puts faith in deep cut to revive oil price” 12/16/08. (2) Bloomberg as of 1/9/09. (3) “Credit issues ahead for energy sector” 12/26/08.
Energy Equity Market Overview (January 2007 – present) Source: Bloomberg, as of 1/9/09.
E&P Sector – Multiple Comparison Source: Factset, as of 1/9/09. Figures represent closing price at quarter end divided by trailing twelve months cash flow from operations.
E&P Sector – Multiple Analysis 7/11/08 “Peak” 1/9/2009 Source: Bloomberg, FactSet and Wall Street research. Note: “Peak” based on average of peak TEV / NTM EBITDA multiples for 2008.
2008 E&P Equity Deals Equity Issuances – All Sector Equity Issuances – E&P Sector Equity Market Activity ($ billions) ($ billions) Source: Dealogic and FactSet as of 12/31/08. Note: Bold denotes RBC managed transaction.
High Yield Market Update Historical High Yield Composite Index Spreads Spread (bps) 01/09/09 = 1,683 bps 12/30/90 = 1,096 bps 10/10/02 = 1,126 bps Bear Markets Early ’90s = 717 bps 1998-2003 = 752 bps Historical Average = 553 bps Bull Market 2004-2007 = 372 bps Bull Markets 1980s = 377 bps Mid ’90s = 400 bps Source: Bloomberg
High Yield Market Update High Yield Spreads Since January 2008 Spread (bps) On January 9th 3,037 bps 1,683 bps 1,450 bps 1,141 bps Source: Bloomberg
“BB” rated “B” rated E&P High Yield – Spread to Treasuries Spread (bps) Spread (bps) Note: RBC data; comprised of a sampling of bonds from each rating category.
Fund Flows – All Sector New Issuances – All Sector New Issuances – E&P Sector 2008 E&P High Yield Deals High Yield Market ($ billions) ($ billions) ($ millions) Source: Dealogic Note: Bold denotes RBC managed transaction.
Successful Deals Q1 2009 Deals in the Market E&P A&D Market ($ millions) • Approximately $3 Billion currently being marketed • Very few deals on the market currently • RBC anticipates a much busier second quarter with many packages coming from Public sellers Source: RBC Richardson Barr database.
What This All Means • Entry point for long-term commodity bullish investors • Low commodity prices + low valuations • Expected Distressed Situations – Bankruptcies? • Lower cash flow • Lower investment = slower / no reserve and production growth • Downward borrowing base adjustments • Negative reserve revisions • Little access to cash from asset sales until buyers return • Over-Equitized Equity Investment by Private Equity • 2009 is “The Year of the Merger or JV” • Strong + Weak • Weak + Weak • JV for cash or carried interest to preserve liquidity
It’s Not All That Bad, is it? • Yes it is – for now • However… • High Yield Market showing signs of life for BB names • Select equity transactions for opportunistic acquisitions or salvation • Significant assets should be available in 2009 for liquid buyers as a result of downward borrowing base adjustments • Merger of equals on an equivalent value basis always an opportunity but subject to bank participation “It’s darkest before the dawn”
Contact Information Jason T. MeekManaging Director Phone: (713) 403-5620 Email: jason.meek@rbccm.com For an email of the presentation, please send “IPAA Presentation” in the subject line to jason.meek@rbccm.com