20000
49090.00. 100. %. 24546.00. 0. mass. 20000. 25000. 30000. 35000. 40000. 45000. 50000. 55000. 60000. 146. Figure E2. ESMS data of the PE24 variant S507C. The peak corresponding to the mass of the Cys replacement is at

20000
E N D
Presentation Transcript
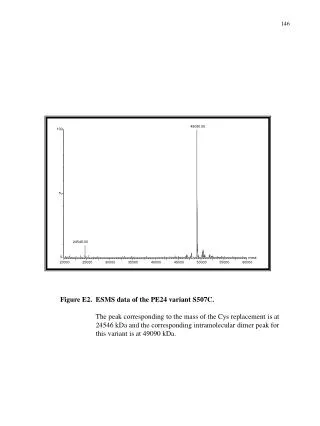
49090.00 100 % 24546.00 0 mass 20000 25000 30000 35000 40000 45000 50000 55000 60000 146 Figure E2. ESMS data of the PE24 variant S507C. The peak corresponding to the mass of the Cys replacement is at 24546 kDa and the corresponding intramolecular dimer peak for this variant is at 49090 kDa.
24546.00 100 % 0 mass 20000 21000 22000 23000 24000 25000 26000 27000 28000 29000 30000 147 Figure E3. ESMS data of PE24 variant S515C.
24546.00 100 % 0 mass 20000 21000 22000 23000 24000 25000 26000 27000 28000 29000 30000 148 Figure E4. ESMS data of PE24 variant S459C.
100 24540.00 % 25760.00 27372.00 0 mass 23000 24000 25000 26000 27000 28000 29000 149 Figure E5. ESMS data of PE24 variant T442C.
24546.00 100 % 0 mass 20000 21000 22000 23000 24000 25000 26000 27000 28000 29000 30000 150 Figure E6. ESMS data of PE24 variant S410C.
24541.91 100 28980.00 % 0 mass 20000 21000 22000 23000 24000 25000 26000 27000 28000 29000 30000 151 Figure E7. ESMS data of PE24 variant S585C.
152 Figure E8. NMR spectra of NATA. The above spectrum shows the NMR signals of the NATA in DMSO-d6.
153 Figure E9. NMR spectra of Naph. The above spectrum shows the NMR signals of the Naph in DMSO-d6.