Download
1 / 50
520 likes | 885 Vues
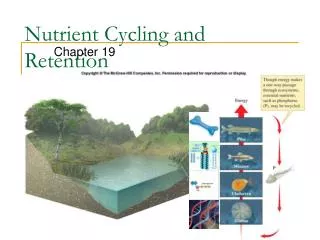
Chapter 19 Nutrient Cycling and Retention. Objectives. Students will be able to describe the major reservoirs of important nutrients and the processes that move nutrients between these pools and plant-usable exchangeable pools.

E N D
Chapter 19 Nutrient Cycling and Retention
Objectives • Students will be able to describe the major reservoirs of important nutrients and the processes that move nutrients between these pools and plant-usable exchangeable pools. • Students will be able to describe factors that control biological nutrient cycling. • Students will be able to describe experiments to test the influence of factors on biological nutrient cycling.
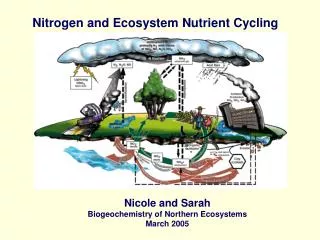
Energy Flows, Nutrients Cycle Nutrient Solar Radiation Heat Radiated to Space Energy Flow Through Ecosystem Cycles
Nutrient Pools • Reservoir Pools:The largest pool where most of the nutrient is found Atmosphere Hydrosphere Lithosphere • Exchangeable Pools:The pool / chemical form(s) of nutrients that are available for use by living organisms • Dissolved in water • Free ions on soil particles • Organic matter
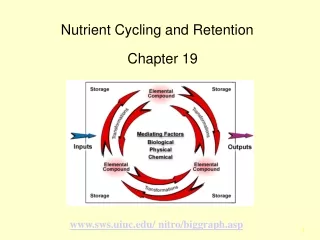
Generalized Nutrient Cycle Reservoir Pool Atmosphere Lithosphere Abiotic Exchangeable Pool Soil Water Organic Matter in Plants Organic Matter in Herbivores Dead Organic Matter Organic Matter In Detritivores Organic Matter in Carnivores Organic Matter In Bacteria & Fungi Excretion Decomposition Mineralization
Nutrient Cycling • Fluxes from reservoir to exchangeable pools are often slow (weathering, N-fixation). • Most nutrients in exchangeable pools are present due to nutrient cycling. • Decomposition • Mineralization • Losses from the exchangeable pool due to erosion, harvesting, sedimentation must be replaced by fluxes from reservoir pool. • Gaseous nutrients are replaced more rapidly than mineral (sedimentary) nutrients.
Factors That Influence Rate of Decomposition and Nutrient Cycling • Climate:Metabolic rate of organisms in detrital food web controlled by temperature and water availability. • Nutrient Availability (in environment and in dead organic matter): Low nutrient content in DOM and in the environment slows population growth of decomposer species. • Grazers accelerate the breakdown of plant organic matter and nutrient re-cycling.
Decomposition of Tree Leaves Dry vs. Wet Environments Decrease in mass of dead organic matter over time is the measure of decomposition rate Leaves decomposed faster in the wet environment
Decomposition Rate Is Directly Related to Actual Evapotrans-piration Rate Why ? Ecosystems with high AE have high rainfall and high temperature. Good conditions for microbial activity.
Decomposition Rate Is Greater In Tropical vs. Temperate Forests
Plant Matter w/ High Nutritional Value Decomposes Faster Foliage w/ Low C:N Ratio and Low Content of Cellulose and Lignin Decomposes Faster.
Decomposition Rate vs. Lignin and Nitrogen Content of Leaf Matter Warmer Why is the ground in a pine forest covered with dead pine needles ? Is this a problem ? Cooler Bad Food
Decomposition Rates Increase with Greater Nutrient Availability in the Environment
Decomposition Rate vs. [Phosphorus]inStream Water At high phosphorous levels, further increases did not increase decomp- osition rate. WHY NOT ? At low phosphorous levels, increasing P caused significant increase in decomposition rate of leaf matter
Effect of Grazing on Plant Biomass Turnover (Nutrient Cycling)
Objectives • Students will be able to describe how agriculture and forestry impact soil nutrient budgets. • How factors of rotation length, harvest intensity, and nature of the nutrient influence impact. • Consequences / Mitigation of nutrient depletion • Students will be able to describe how human activities can saturate natural ecosystem nutrient pools and the consequences of nutrient saturation.
Agriculture and Forestry • Harvesting of biomass and soil erosion from human crop systems remove nutrients from the ecosystem. • Natural fluxes from reservoir pool replenish exchangeable nutrient pools, depending on rates of input vs. output in harvests. • Additions of manure and chemical fertilizer often necessary to maintain exchangeable nutrient pools in soil (and productivity)
Balancing the Nutrient Budget Atmospheric Deposition Slowly Replenished Rapid Loss Exchangeable Nutrient Pool In the Soil Weathering Of Soil Minerals Nutrients in harvested crop Soil erosion Nutrient leaching Manure Fertilization Decomposition of crop residue
Harvest Interval and Nutrient Depletion Long Rotation (Forestry) |---Harvest Interval---| Soil Exchangeable Nutrient Pool Time With enough time between harvest removals, the exchangeable nutrient pool is maintained by natural fluxes from reservoir pool
Harvest Interval and Nutrient Depletion Long rotation Harvest Interval Soil Exchangeable Nutrient Pool Short Rotation (Agriculture) Time With insufficient time between harvests to allow for natural replenishment, soil nutrient pools are depleted. Crop production will decrease over time.
Harvest Intensity and Nutrient Depletion Corn Soil Exchangeable Nutrient Pools Cotton Time Crops that remove a larger amount of nutrients require a longer time period between harvests or soil nutrient pools will be depleted.
Harvesting Effects On Different Nutrients Rapid Input Flux from Reservoir Pool (N) Soil Exchangeable Nutrient Pool Slow Input Flux from Reservoir Pool (P) Time Slowly cycled mineral nutrients (Ca, Mg, K, P) are more readily depleted than more rapidly cycled gaseous nutrients (N, C, S).
Managing Soil FertilityCrop Rotation: 4 Year Cycle Nutrient Extractive Crop (Corn, Cotton, Wheat, Rice) N-Fixing Crop Replenish Soil N Pool (Soybean, Alfalfa) Fallow Year (No Crop) Replenish Soil Nutrients Hay, Grass Cover “Green Manure” Crop Replenish Soil Organic Matter Hay, Alfalfa
Managing Soil FertilityCrop Rotation: 2 Year Cycle N-Fixing Crop Replenish Soil N Pool (Soybean, Alfalfa) Nutrient Extractive Crop (Corn, Cotton, Wheat, Rice) What about…. Chemical Liming And Fertilization Other Nutrients (Ca, Mg, K, P) ? Degraded water retention, aeration, drainage Soil Organic Matter ?
Fertilizer Use and the Green Revolution Corn Yield U.S.A Wheat Yield Major gains in crop production from the Green Revolution required massive increases in the use of chemical fertilizer
A Case StudyAgricultural Trends In Georgia (USA): 1940 – 1990 • Acreage of agricultural land decreased by 50% (farm abandonment) • State-wide total agricultural crop production increased by 100% • Crop yield per acre increased 4-fold. • How did this happen ???
A Case StudyAgricultural Trends In Georgia (USA): 1940 – 1990 • Total use of fertilizer (per acre) increased7-fold • Use of Nitrogen fertilizer increased 11-fold. • Is this a problem ? • Excess nutrients from fertilizer washes into streams, lakes, and groundwater (more later). • Dependence on expensive fertilizers puts farmers at economic risk.
Agricultural Economics Fertilization Increases Crop Yields (and also Costs) Increased Grain Supply to Consumer Market N-fertilizer made using fossil fuel. Sensitive to price fluctuations The same companies that buy the crops also sell the seed and fertilizer. Price per Bushel Decreases Farmer Income Decreases: Grain Sales Receipt – Costs (fuel, seed, fertilizer)
Agriculture In the Wet Tropics A Cautionary Tale of Nutrient Cycling Limits for Agriculture
Total Ecosystem Carbon In Boreal and Tropical Forest Ecosystems
Slash-and-Burn Agriculture • Cut-down and burn forest vegetation to release nutrients to the soil. • Initially, crop yields are high. • Crop yields progressively decline. • Field abandoned after 3 to 5 years. • Sustainable w/ SMALL human populations, but NOT w/ large human populations.
Nutrient Leaching After Slash-and Burn Calcium Cut Burned Abandoned High crop yields immediately after burn are associated with a large pulse of basic cations into the soil from the burned vegetation Decreasing crop yields over 3-5 years associated with decreased pools of basic cations in the soil
Primary Productivity (kg / ha/ yr) of Rain Forest vs. Slash-and-Burn Crop
Phosphorous Dynamics of Slash-and-Burn P in Soil Minerals P in Atmospheric Dust Deposition Weathering Insoluble P In the Soil P in Plant Biomass Uptake Plant-Available P In the Soil Decomposition and Burning Low pH – P precipitates Neutral pH – P dissolves Very low in intact rain forest ecosystems P-removal in harvested biomass P-loss to atmosphere in ash from fire P-loss due to leaching and soil erosion
Phosphorous Dynamics in Tropical Soil After Slash-and-Burn There is a large pool of soil phosphorous, but only a small percentage is available for plant uptake. Ash from burning increases soil pH, increasing the amount of plant-available P
Burn Rain Forest (release nutrients from biomass to soil) Increase Base Cations Ca, Mg, K in soil Increased Soil pH Increase Exchangeable Phosphorous Decrease Toxic Metals Fe, Mn, Al Re-Growth of Tropical Rainforest (Recovery Phase) The Slash-and Burn Cycle High Crop Yields Land Abandonment Removal of Ca, Mg, K In Crops Loss of Ca Mg, K via Leaching Decreased Crop Yields & Increased “Weeds” Decreased Exchangeable P Decreased Soil pH Increased Toxic Metals Fe, Mn, Al
Nutrient Saturation The Other Side of Human Impacts on Nutrient Cycles
Soil Nutrient Capacity vs. Content Soil Capacity Soil Content Plant Uptake - Harvest Loss Natural Inputs Decomposition Mineralization N-Fixation Weathering If losses exceed inputs ► Nutrient depletion (Content << Capacity)
Nutrient Saturation Fertilizer Acid Rain Manure Soil Capacity Natural Inputs + Human Inputs Soil Content Plant Uptake Leaching to Groundwater If inputs exceed losses ► Nutrient saturation (Content = Capacity)
“Dead Zone” Formation (Hypoxic Bottom Water)
“Acid Rain” Adds Excess Nutrients Excess Inputs of N and S From Atmosphere Soil Saturated w/ N and S Excess NO3- and SO4- Leach From Soil Base Cations Ca, Mg, K, Na Leach From Soil Decreased Soil pH Increased Toxic Soluble Al Decreased Plant Growth “Forest Decline” Excess Al Leaches Into Streams Al Toxicity Kills Aquatic Organisms “Dead Lakes”
Summary • “Sustainability” of agricultural production systems and “Health” of natural ecosystems require balancing of nutrient budgets. • Nutrient depletion of agricultural systems requires expensive chemical fertilization that may not be sustainable long-term. • Nutrient saturation of natural systems is a major risk to ecosystem health.