Understanding Equity Statistics
This article provides an overview of various measures of horizontal equity, including range, restricted range, coefficient of variation, and Gini coefficient. Each measure has its pros and cons, such as how well they account for outliers and inflation. We discuss the importance of these metrics in evaluating equity in educational funding, emphasizing the Gini coefficient's utility in gauging income equity. The insights shared aim to offer a clearer understanding of how equity can be assessed quantitatively within the educational finance context.

Understanding Equity Statistics
E N D
Presentation Transcript
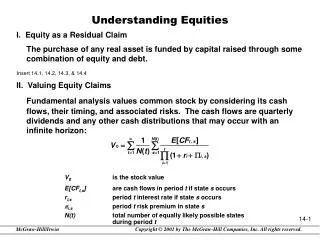
Understanding Equity Statistics Lawrence O. Picus
Measures of Horizontal Equity • Range • Difference Highest minus Lowest • Pros • Includes all observations • Cons • Only measures two observations • Outliers not accounted for • Sensitive to Inflation
Measures of Horizontal Equity • Restricted Range • Difference Between Observation at 95th Percentile and 5th Percentile • Pros • Generally avoids problems of Outliers • Cons • Still only two observations • Sensitive to Inflation • Preferred to Range, but Still not Great
Measures of Horizontal Equity • Federal Range Ratio 95th - 5th 5th • Indicates how much larger the observation at the 95th percentile is than the observation at the 5th percentile
Coefficient of Variation • CV = STD / Mean • Describes the amount of variation around the mean • Often expressed as a percent • For Example 0.1 = 10%
Coefficient of Variation • Pros • Includes all values in the data set • Does not change with inflation • Easy to understand • Cons • What is the value that determines a fair or equitable distribution? • Use a relative or absolute standard? • We suggest a target goal of 0.1
Gini Coefficient • Lorenz Curve • Used in Income Equity Analyses • Measures the proportional share of total revenue in the state for a proportion of students
Gini Coefficient • Value of Gini: A / (A+B) • Value ranges from 0 to 1 • Smaller Values Represent Greater Equity • If expenditures are completely equal, A = 0 and the Gini Coefficient becomes 0