Download
1 / 49
490 likes | 774 Vues
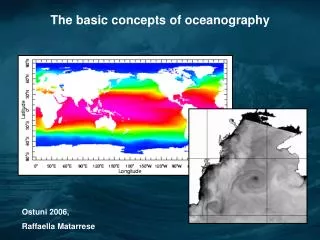
Marine Science 320 El Niño Southern Oscillation. Equatorial upwelling chlorophyll from Seawifs during June-August 1998. 1. El Niño-Southern Oscillation (ENSO). NOAA PMEL El Niño Theme Page http://www.pmel.noaa.gov/tao/elnino/nino-home.html

E N D
Marine Science 320 El Niño Southern Oscillation Equatorial upwelling chlorophyll from Seawifs during June-August 1998 1
El Niño-Southern Oscillation (ENSO) • NOAA PMEL El Niño Theme Pagehttp://www.pmel.noaa.gov/tao/elnino/nino-home.html • Southern Oscillation (atmosphere) andEl Niño (ocean) processes were identified separately, and subsequentlylinked • Walker: noted ‘see-saw’ connection in barometer data from Tahiti and Darwinand coined the term Southern Oscillation • Jacob Bjerknes connected SST, winds and SLP with atmosphere/ocean dynamics Sir Gilbert Walker • failure of monsoon rains (and famine) in 1899 • claimed Asian monsoon linked to drought in Africa and Australia, and mild winter in Canada • Widely criticized, theory dismissed (no dynamical explanation) • Never succeeded in predicting monsoon failures http://library.thinkquest.org/20901/overview_2.htm
When SOI is negative: p.g. is weaker than usual corresponds to El Nino (or ENSO warm event) Definition of the Southern Oscillation Index [ Pdiff - Pdiffav ] SOI = ----------------- SD(Pdiff) Oct2014 Pdiff = (Tahiti MSLP) - (Darwin MSLP) monthly averagedPdiffav = long term (years) average of Pdifffor that monthSD(Pdiff) = long term standard deviation of Pdiff Sometimes SOI is given multiplied by 10 in which case it ranges from about –35 to about +35 (i.e. +/- 3.5 std. dev.) http://iridl.ldeo.columbia.edu/maproom/.ENSO/.Time_Series/SOI.html
http://www.pmel.noaa.gov/tao/elnino/nino-home.html http://www.pmel.noaa.gov/tao/jsdisplay/
Trades weaken in Feb/Mar Upwelling slows and water warms Strong Trade winds Cold upwelled water easterlies westerlies
December 1997 Positive anomaly means winds are more westerly (toward the east) than average
El Nino - warming first occurs subsurface in the central Pacific because the thermocline is being displaced downward. http://meteora.ucsd.edu/~pierce/elnino/en97/en97.html
Warming due to thermocline displacement occurs all across. It is shallower in the east because the thermocline itself is shallower
SST now increases, apparently starting from the east, but largely due to what is happening subsurface
Loss of heat from the west has cooled the WPWP at depth Warming travels up the N.Amer west coast and spreads out into the Pacific – very slowly
El Nino contracts but waters are still cool to the west. The WPWP must reset itself slowly …
Negative means much less rain in 1999 than 1998 Positive is more rain in 1999 than 1998 ENSO conditions Top right: Two-month mean rainfall rate (mm/mon) for Jan/Feb 1998. Heavy rainfall appears over the South Pacific Convergence Zone (SPCZ), South Indian Ocean, and the South America. Bottom: Difference in the Jan/Feb mean rainfall 1999 minus 1998. During ENSO warm event (El Niño) in 1998 central Pacific rainfall is anomalously high, and west Pacific rainfall is anomalously low.
ADCP Deep water Assessment and Reporting of Tsunamis (DART) mooring.
Consider what would happen next if any of the following occurred: The Trade winds weakened Central Pacific SST warmed Rainfall increased in the central Pacific
Consider what would happen next if any of the following occurred: The Trade winds weakened … * equatorial upwelling would slow down* SST would rise in the central Pacific* atmospheric convection would occur more quickly* the region of precipitation would move to the east closing the Walker cell sooner … weakening the Trade winds in the west A positive feedback that amplifies initial the Trade wind weakening
Consider what would happen next if any of the following occurred: 2. Central Pacific SST warmed … * atmospheric convection would occur more toward the east * the region of precipitation would move to the east closing the Walker cell sooner * weakening the Trade winds * equatorial upwelling would slow down* SST would rise in the central Pacific
Consider what would happen next if any of the following occurred: 3. Rainfall increased in the central Pacific … * the Walker cell would close more toward the east * weakening the Trade winds * equatorial upwelling would slow down* SST would rise in the central Pacific* atmospheric convection and rainfall would occur more toward the central than western Pacific
There is some evidence that a trigger for ENSO warm events might be westerly wind bursts in the western equatorial Pacific. • A wind burst such as this sets in train wave motions that are characteristic of the equatorial region. • The westerly wind burst causes: • converging Ekman transports (off equator) that increase sea level • and depress the thermocline • eastward geostrophic flow converges to the east • and diverges to the west • the pattern moves eastward • Note that the same happens for an easterly wind burst: the equatorial Kelvin waves only go east so the anomalous pattern cannot easily reset itself even if the WWB is followed by easterly wind anomalies. • The equatorial Kelvin wave speed Explain Kelvin wave dynamics and westerly wind anomaly is about 2.5 m/s (roughly ~200 km/day) The observed speed is about 10 – 20% faster than this due to advection by the EUC
http://www.pmel.noaa.gov/tao/elnino/nino-home.html Present conditions: Format size 75% http://www.pmel.noaa.gov/tao/jsdisplay http://iridl.ldeo.columbia.edu/maproom/.ENSO/.Time_Series/SOI.html NOAA ENSO Advisory: http://www.cpc.ncep.noaa.gov/products/analysis_monitoring/enso_advisory/ensodisc.html
Fig 1. Average sea surface temperature (SST) anomalies (oC) for the week centered on 27 August 2014. Anomalies are computed with respect to the 1981-2010 base period weekly means. NOAA ENSO Advisory: http://www.cpc.ncep.noaa.gov/products/analysis_monitoring/enso_advisory/ensodisc.html
Next: upper ocean heat content … Fig 2. Time series of area-averaged sea surface temperature (SST) anomalies (oC) in the Niño regions. Anomalies are departures from the 1981-2010 base period pentad means.
Fig 3. Area-averaged upper-ocean heat content anomaly (oC) in the equatorial Pacific (5oN-5oS, 180o-100oW). The heat content anomaly is computed as the departure from the 1981-2010 base period pentad means. Fig 4. Depth-longitude section of equatorial Pacific upper-ocean (0-300m) temperature anomalies (oC) centered on the pentad of 26 August 2014. The anomalies are averaged between 5oN-5oS. Anomalies are departures from the 1981-2010 base period pentad means.
Easterly upper-level wind anomalies prevailed during August, and SOI has been negative. Convective cloudiness was near average over most of the region, except for the central-western Pacific (Fig. 5). (Positiveanomalies imply decreased cloudiness and precipitation.) The lack of a coherent atmospheric El Niño pattern and near-average SST in the central Pacific indicate a continuation of ENSO-neutral. Fig 5. Average outgoing longwave radiation (OLR) anomalies (W/m2) for the four-week period 1-26 August 2014. OLR anomalies are computed as departures from the 1979-1995 base period pentad means
Most models continue to predict El Niño to develop during Sep-Nov and continue into early 2015 (Fig. 6). • A majority of models and the multi-model averages favor a weak El Niño. • Forecasters expect El Niño to peak at weak strength during the late fall and early winter (3-month values of the Niño-3.4 index between 0.5oC and 0.9oC). • The chance of El Niño is at 60-65% during the Northern Hemisphere fall and winter Fig 6. Forecasts of sea surface temperature (SST) anomalies for the Nino 3.4 region (5oN-5oS, 120Wo-170oW). Figure courtesy of the International Research Institute (IRI) for Climate and Society. Figure updated 19 August 2014