Download
1 / 27
270 likes | 392 Vues
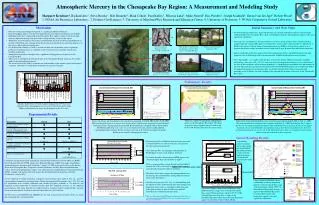
An atomic fluorescence-based, reagent-free, field-deployable mercury analyzer. Joel Creswell, Ph.D. Technical Director. Background. Problems with field monitoring of mercury: Sampling is expensive Handling causes contamination Samples must be transported Cost & effort limits frequency

E N D
An atomic fluorescence-based, reagent-free, field-deployable mercury analyzer Joel Creswell, Ph.D. Technical Director
Background • Problems with field monitoring of mercury: • Sampling is expensive • Handling causes contamination • Samples must be transported • Cost & effort limits frequency • Unmet research needs: • Real-time data • High frequency sampling • Continuous monitoring • Lower-cost method University of Wisconsin – Eau Claire
Potential Benefits • Real-time data: • Simplify synoptic surveys • No need to return to lab to see results • Make quick decisions about further sampling • High frequency sampling • Currently possible but challenging • Required to characterize storm flows, mass fluxes (e.g., Balcom et al., 2004; Balogh et al. 1997; Mason et al., 1999) • Can provide resolution of individual rain events • May allow monitoring of new processes (e.g. throughfall) (e.g. Fisher & Wolfe, 2012) Balogh et al., 1997
Potential Benefits • Continuous monitoring • Much less expensive • Can offer real-time data access via web • Less handling = more consistent data quality • Lower cost method • Enables more monitoring
Approach • Design a system that: • Operates reagent-free • Uses minimal carrier gas • Requires maintenance < monthly • Is highly sensitive (0.1 ng/L detection limit) • Has high throughput (5 mins/sample) • Is self-cleaning (no carryover) • Is self-calibrating (no drift) • Is remotely controllable • Offers remote data access
Detailed Schematic Carrier Gas Inlet Calibrator Sample Loop Cleanup Trap Air Inlet Analytical Trap Catalyst Dryer Carbon Traps Pump Detector Filter Fan Decomp. Chamber Waste Temperature Controlled Zones Sample Inlet
Instrument Overview Sample dryer and gold trap Sample decomposition chamber & catalyst Detector and calibration system Sample loop injection system Pinch valves Sample loop bypass Sample loop In Out Peristaltic pump
Detector and Calibration System Loop 1 Loop 2 Carbon Trap Detector
Field Testing ¼” FEP Sampling Line
Field Testing Ar Cylinder 0.45 µm Capsule Filter
Results iPhone 4 Internet Explorer 10
Results iPhone 4 Internet Explorer 10
Instrument Control iPhone 4 Internet Explorer 10
Software Overview User-customizable sequences
Results • Linear calibrations over the course of the day • Temperature stability will minimize drift
Results • Field testing data • Good retention time consistency • Optimizing to minimize carryover
Goals for Finished Product • 0.1 ng/L detection limit • 5 mins/sample • < 0.1% carryover • Unattended operation for 1 month • Possible at current gas consumption with a size 40 cylinder (6.73” OD x 17.4” tall, 23.5 lbs.) • Reduce size and weight • Operate on standard 15 A, 120 V power outlet or lesspower
Goals for Finished Product • Minimal signal drift over time • Robust performance with matrix interferences: • DOC • Dissolved solids • Extreme pH • Instrument control & data access via web portal and cellular/satellite data networks • Time-programmed or externally triggered sample analysis
Development Schedule • February – November, 2012 • Phase I prototype development & testing • May – December, 2013 • Phase II re-engineering & lab testing • January – April, 2014 • Local field testing & design refinement • May, 2014 – January, 2015 • Beta unit production & field testing • February – April, 2015 • Finalize design & begin production
Field Testing Locations King County USGS MDN ORNL EPRI
What are your needs? • Software requirements • Hardware requirements • Sampling frequency • Detection limits • Portability • Power • Service frequency
Acknowledgements • Steve Gunther, Brooks Rand • Phase I mechanical/design engineer • Paul Danilchik, Independent Contractor • Phase I electrical/software engineer • Carrie Miller, Oak Ridge National Lab • Phase I field testing partner • Jeremy Divis, Brooks Rand • Commercialization specialist • Colin Davies, Brooks Rand • President, project strategist • Department of Energy Small Business Innovation Research Program • Funding agency