Download
1 / 18
180 likes | 328 Vues
Uncovering Clusters in Crowded Parallel Coordinates Visualizations. Alimir Olivettr Artero , Maria Cristina Ferreiara de Oliveira, Haim levkowitz Information Visualization 2004. Abstract. The idea is inspired by traditional image processing techniques such as grayscale manipulation.

E N D
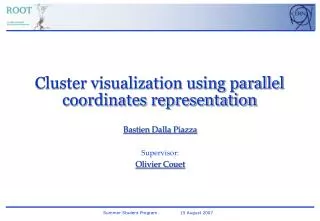
Uncovering Clusters in Crowded Parallel Coordinates Visualizations AlimirOlivettrArtero, Maria Cristina Ferreiara de Oliveira, Haimlevkowitz Information Visualization 2004
Abstract • The idea is inspired by traditional image processing techniques such as grayscale manipulation. • Reducing visual clutter and allowing the analyst to observe relevant patterns in the parallel coordinates.
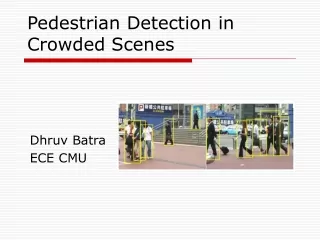
Introduction • The strong overlapping of graphical markers hampers the user’s ability to identify patterns in the data when the number of records and the dimensionality of the data set are high. • It is important to avoid displaying irrelevant information and enhancing the presentation of the useful one.
Introduction • Tackling this problem with a strategy that computes frequency and density information, and uses them in parallel coordinates visualizations to filter out the information to be presented to the user.
Frequency Information • The frequency function for a n-dimensional variable x is defined as : where h is the size of bins, σ is the number of records in the same bin, m is the number of all records.
Frequency Information • A two-dimensional matrix is generated to store the frequency of each pair of attribute values, which is then used to draw the polygonal lines for the records in the data set. • For a data set with n attributes, n-1 frequency matrices are generated, one for each pair of attributes.
Frequency Information • All the non-zero matrix elements generate a line segment in the visualization and the pixel intensity used to draw the line segment. • Each line segment is drawn with the Bresenham algorithm:
Interactive Parallel Coordinates Frequency and Density plots • The intensity of the pixel with coordinates (q,p) is given by: • Square wave smoothing filter is used for each pixel:
Interactive Parallel Coordinates Frequency and Density plots • S is a scaling factor.
Density Information • The density function for a n-dimensional variable x is defined as : where diis the i-th record of the data set and K is the kernel function, the parameter defines a smoothing factor or bandwidth.
visualizations of the Pollen data a) Frequency Plot b) Density Plot
Performance • Running times in seconds for the proposed algorithm with different values of m and n.
Conclusions • The new plots support interactive data exploration of large and high-dimensional data sets, allowing users to remove noise and highlight areas with high concentration of data. • The proposed algorithms use only integer arithmetic to compute the frequency matrices.