
Uploaded by
langer
4 SLIDES
237 VUES
50LIKES
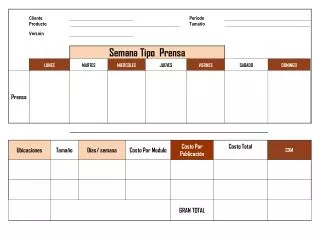
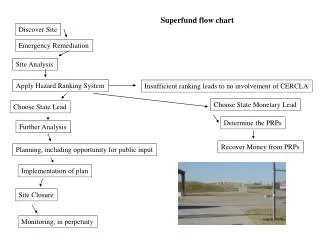
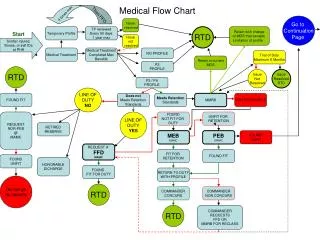
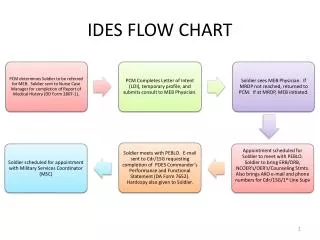
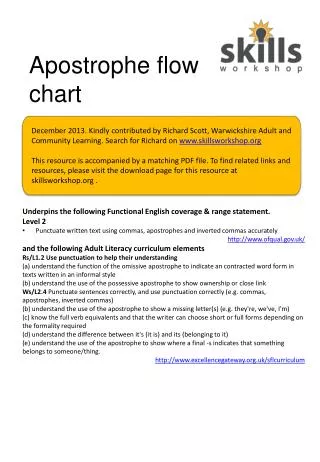
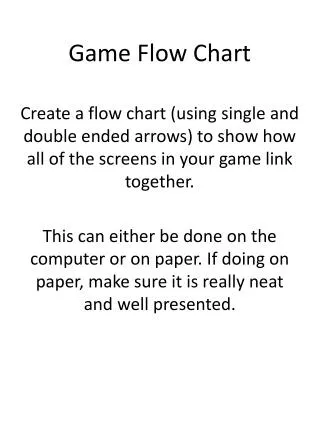
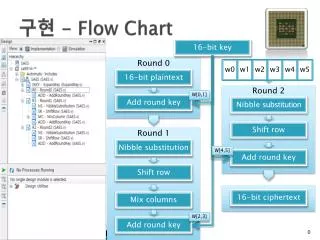
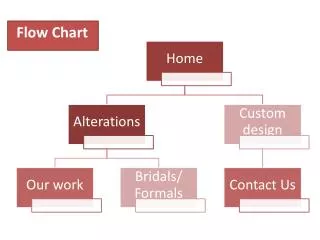
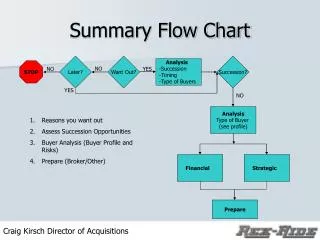
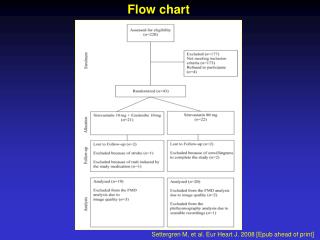
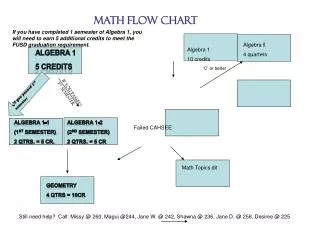
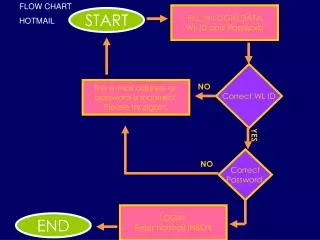
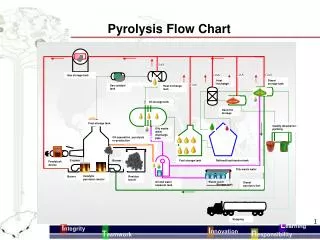
Understanding Flow Charts: A Visual Representation for Problem Solving
DESCRIPTION
Flow charts are graphical tools that illustrate processes or systems in a clear and organized manner. They utilize shapes like arrows, circles, and rectangles to depict the flow of information or operations. Useful in various fields including business, engineering, and education, flow charts aid in problem-solving by breaking down complex processes into understandable segments. By following the flow, stakeholders can easily identify steps, decisions, and outcomes, thereby facilitating better communication and efficiency in projects.
Download
1 / 4
Download Presentation

Télécharger la présentation
Understanding Flow Charts: A Visual Representation for Problem Solving
An Image/Link below is provided (as is) to download presentation
Download Policy: Content on the Website is provided to you AS IS for your information and personal use and may not be sold / licensed / shared on other websites without getting consent from its author.
Content is provided to you AS IS for your information and personal use only.
Download presentation by click this link.
While downloading, if for some reason you are not able to download a presentation, the publisher may have deleted the file from their server.
During download, if you can't get a presentation, the file might be deleted by the publisher.
E N D


More Related
Audio
Live Player