Download
1 / 51
510 likes | 627 Vues
This research investigates the performance of IP-QoS within the Differentiated Services (DiffServ) framework, focusing on the allocation of minimum bandwidth guarantees during interface congestion. We analyze two prominent router technologies: 1GE and POS_OC-48 from Cisco, Juniper, and Procket. By using UDP CBR traffic and a simple QoS model, we explore bandwidth allocation across two classes, BE and LBE, employing a set of specific bandwidth couples. Key metrics such as received throughput and bandwidth allocation accuracy are evaluated to understand their implications on network performance.

E N D
IP-QoS Benchmarking in Gigabit Networks Andrea Di Donato University College London (UCL) Gnew 2004 – CERN, Geneva
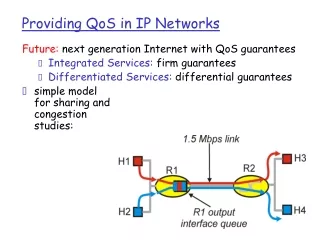
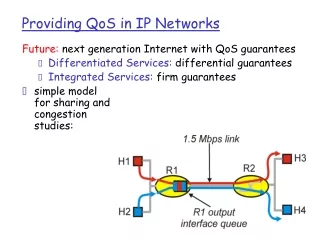
Introduction • The deployment of IP-QoS in the Differentiated Services (DiffServ) framework both in the access and in the core networks requires an in depth knowledge of the performance of two of the currently most deployed router cards technology: 1GE and POS_OC-48. • The evaluation of their performance is based on how precisely a minimum bandwidth guarantee can be allocated to an aggregate of data traffic under interface congestion and not; it constitutes the foundations for the deployment of more complex IP QoS solutions.
Introduction (cont.) • The QoS model we use is based on the Differentiated Services (DiffServ) model for IP networks. • The traffic entering the network device is marked by the sending host using a single Differentiated Services Code Point (DSCP). For each one of these code-points there is assigned a different behaviour aggregate or class. • This work studies the QoS performance of this two technologies provided by Cisco, Juniper and Procket. • UDP CBR traffic is used as TCP is not controllable.
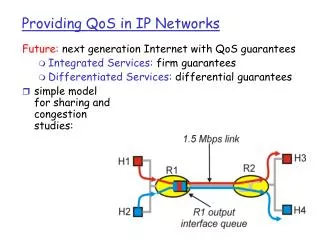
Test-bed (generic) • Two classes only are configured: nominally BE and LBE. They differ in the percentage of the port capacity (Mbps) allocated. The QOS configuration is kept simple on purpose. • LBE is used here with the broadest meaning possible which is that of an IP class whose BW allocation is complementary to 100 with that of BE (should be OtherThanBE=OTBE) • The BW allocation set chosen for the tests was mainly the following sequence of couples: • BE-LBE = (99-1, 98-2, 97-3, 96-4, 97-3, 95-5, 94-6, 93-7, 92-8, 91-9, 90-10, 85-15, 80-20, 75-25, 70-30, 65-35, 60-40, 55-45, 50-50) • We refer to the sequence above as the “BW allocation couples axis” with the axis direction going from 99-1 to 50-50. Generic Router Cisco 7609 Procket 8801 Juniper M10 OC-48 Or GE
PCs and traffic • Three PCs (Supermicro 6022P-6 Dual Intel® Xeon) were attached to the two routers. Each PC had an Intel® PRO/1000 XT Server Gigethernet adapter (e1000v4.4.12-k1) • The PCs were running Linux kernel version 2.4.20. • “Iperf” [version 1.6.5 (13 Jan 2003) pthreads] was the application-level tool used to inject UDP CBR traffic
PCs benchmark To achieve line rate from the PCs, we required a packet size quite close to the Ethernet MTU. We chose a packet size of 1470 bytes for our tests. The maximum achieved UDP-level throughput at this packet size for the PCs plugged back-to-back is 955Mbps (line rate !!)
Metric [atomic] • Received Throughput Analysis • Link Utilisation • sum of the per-class received throughput (Mb/s) • BW allocation error analysis: • Absolute Error • WhatClassXgets – WhatClassXshouldGet (Mb/s) • Relative Error • [AbsoluteError]*100/WhatClassXshouldGet (%) • This double metric is required since a good link utilisation is only necessary, not also sufficient, in order to have an equally good BW allocation precision.
Metric (cont.) “WhatClassXshouldGet” - algorithm Is the Interface Congested? LEGENDA C=L3 capacity Spare= BW not allocated all = allocated exp = expected X = one of the two classes involved no Xexp=Xsent Yexp= Ysent yes No (X and Y both over-subscribed) Is class X Under-subscribed? Xexp=Xall+[Xall/(Xall+Yall)]*spare Yexp=Yall+[Yall/(Xall+Yall)]*spare yes • Compatible with • wfq (Cisco,Juniper) • dwrr (Procket) Xexp=Xsent Yexp= C - Xsent
Metric: some notes Offered load axis Port not Congested Port Congested: BE undersubscribed (BE leftover BW to LBE) and LBE oversubscribed Port Congested: Both BE and LBE oversubscribed
Test Metric (cont.) Accuracy Typically, the accuracy in allocating BW to a class is fixed to be around 95% which in turn means that 2.5% is the maximum error acceptable in module. We refer to the region inside which this bound is validated as the “operating region”.
Composite metric (cont.) • In order to bound an “operating region” over the BW allocation couples axis, a new metric is introduced to synthesize the per-BW-allocation throughput performance along the different port congestion levels: • NEW METRIC (M-L/B_REWS or MAX algebra error): • Definition: • The Maximum value that the LBE and BE Relative Errors taken With Sign (M-LREWS/M-BREWS) assume all over the port congestion level axis. • M-L/B_REWS allows the evaluation of the BW scheduler based solely on its worst performance over the offered_load/port_congestion_level axis. • We refer to the M-L/B_REWS-defined operating region as the “max operating region”, this highlighting that the method used to bound it was that of computing the max algebra for the relative errors along the port congestion levels. • Thus, an accuracy of 95% in the allocation of the BW is equivalent to have the M-LREWS/M-BREWS <= +-2.5%.
Composite metric (cont.) • In order to further investigate the “max operating region” over the BW allocation couples axis bounded by the M-L/B_REWS metric (previous slide), a new metric is introduced to quantify how spread the per-BW-allocation error is over the port congestion level axis: • NEW METRIC: (A-AL/BRE or AVG. algebra Error) • Definition • The Average of the Absolute values of LBE/BE Relative Errors which we refer to as A-ALRE and A-ABRE respectively. • The absolute values are used to avoid that the average of algebraic values could lead to a misleading ~0% errors as the effect of the cross-neutralisation of opposite polarised relative errors of the same order of magnitude • We refer to the so defined operating region as the “avg” operating region, this highlighting that the method used to bound it was that of computing the AVG algebra for the relative errors. • The main difference between the MAX-based and the Averaged-based metrics is that the latter takes account of the errors all over the “offered_load” / “port_congestion_level” axis and not just of the maximum over such axis. This allows quantifying how spread the error is over the port congestion level axis.
Cisco 7609 – OC-48 • This card is a POS OC-48 v2 to whom Cisco refers to as OSM-1OC48-POS-SS+. • The encapsulation used is PPP. • Cisco designed an “engineering code” specific for the scheduler of this card and included it on the major release 12.1(19)E which has been available since May/03. The tests we performed used the IOS version just mentioned. • The iperf UDP-payload-level capacity C of the link, which is obtained by congesting the interface and not configuring qos is 2318 Mbps; The card is therefore congested up to (957*3)/2318=123.8% of its Capacity.
! class-map match-any BE match ip dscp 0 class-map match-any LBE match ip dscp 8 ! policy-map GNEW2004 class BE bandwidth percent X class LBE bandwidth percent Y ! mls qos ! interface input mls qos trust dscp ! interface output service-policy output GNEW2004 mls qos trust dscp ! “mls qos” in the global configuration mode is needed to enable QoS on the supervisor engine “mls qos trust dscp” issued in the input and output interfaces is there to avoid cards to reset the dscp code of packets entering or leaving the output and input interfaces respectively. This configuration line is of particular importance if Catalyst ports are used in the input (not in the output as they don’t support L3 CBWFQ) as they naturally tend to reset to 0 the dscp code. This happens since the legacy L2 COS-based QoS is the default QoS for the catalyst ports as the 7600 is a router built on top of the native Catalyst switch . As an architectural note, Parallel Express Forwarding (PXF) is present on each OSM (Optical Service Module) or card and is capable of CBWFQ, thus permitting the QoS processing directly on the card. Cisco 7609 – OC-48/GE-WANv2 qos-configuration sample
Cisco 7609 – OC-48 results The link utilization is pretty poor for some of the BW allocations and this is sufficient to have bad BW allocation precision. Both BE and LBE relative errors are therefore presented in the next slide with the purpose of: • Quantifying the per-class bw allocation error • Seeing whether the errors are localized in one or more port congestion level zones • Seeing the dynamic of the error in each zone (if any, see point 2) as a function of the BW allocated when a value of the port congestion level is fixed.
Cisco 7609 – OC-48 results (cont.) • The error BE presents (right plot) is < 2% and therefore negligible. • The error is concentrated on LBE and presents positive polarity which suggests, along with the negligible BE error and with the poor link utilization, that the scheduler’s issue is the inability in allocating the BE leftover BW to LBE under a certain range of port congestion levels. • The errors (both the MAX and the AVG over the port congestion level axis) decrease monotonically with the increase of the BW allocation couple axis, therefore suggesting a well defined operating region. The max operating region is shown in the next slide.
Cisco 7609 – OC-48 results (cont.) • In order to determine with precision the operating region, the MAX LBE relative error with sign (M-LREWS) is presented below. • The error oscillates a bit along the value of +2.5%, thus making the definition of the “max” operating region difficult. • A conservative “max”operating region for this card is from the value of 50-49 to that of 75-24 for the BW allocation couples. • The same “max” operating region would range from 50-49 to 93-6 if the precision was 88% instead of 95%.
Cisco 7609 – GE-WANv2 • This card is a GE-WAN v2 to whom Cisco refers to as OSM-2+4GE-WAN+. • The tests we propose make use of the 12.1(19)E IOS version, the same as for the OC-48 card test. • The iperf UDP-payload-level capacity C of the link, which is obtained by congesting the interface and not configuring qos, is 957 Mbps; The card is therefore congested up to (957*2)/957= 200% of its capacity.
Cisco 7609 – GE-WANv2 results Again, as for the OC-48, the link Utilization is pretty poor and this is sufficient to have bad BW allocation precision. Both BE and LBE relative errors are therefore presented in the next slide with the purpose of • detecting whether the BW allocation errors are localized in one or more port congestion level zones • Seeing the error dynamic in each zone (if more than 1...see point 1): • Seeing the dynamic of the errors as a function of the BW allocated when a value of the port congestion level is fixed.
Cisco 7609 – GE-WANv2 results (cont.) • The above figures clearly show how The BE relative error is negligible (<2.5%) while that of LBE is not. • LBE relative error doesn’t even show a monotone decrease of the error per BW allocation couple and per port congestion level, this suggesting a non well defined operating region • The MAX LBE relative error with sign analysis is therefore necessary (next slide) to work out where the boundary of the operating region is. We do not expect it to be monotone (see point 2)
Cisco 7609 – GE-WANv2 results (cont.) • The “max” operating region for this card is from the value of 55-44 to that of 70-29 for the BW allocation couples. • The non monotonicity doesn’t affect the operating region evaluation
Juniper M10 – OC48 • The IOS used was “Junos 5.3R2.4”. • The card version is “1xSTM-16 SDH, SMSR REV 05” • The iperf UDP-payload-level capacity C of the link, which is obtained by congesting the interface and not configuring qos is 2338 Mbps. The card is therefore congested up to (957*3)/2338=2871/2338= 122% of its capacity.
class-of-service { classifiers { dscp UCL-classifier { forwarding-class LBE { loss-priority low code-points cs1; } forwarding-class best-effort { loss-priority low code-points 000000; } } } forwarding-classes { queue 2 LBE; queue 0 best-effort; } interfaces { input { unit 0 { classifiers { dscp UCL-classifier; } } } output { scheduler-map MAP-UCL; unit 0 { classifiers { dscp UCL-classifier; } } } scheduler-maps { MAP-UCL { forwarding-class LBE scheduler sch-LBE; forwarding-class best-effort scheduler sch-BE; } } schedulers { sch-BE { transmit-rate percent X; buffer-size percent X; priority high; } sch-LBE { transmit-rate percent Y; buffer-size percent Y; priority low; } } } Juniper M10 – OC48/GE configuration sample
Juniper M10 – OC48/GE configuration sample (cont.) • Juniper has a priority queuing mechanism which is not a strict priority mechanism. • The queue weight ensures the queue is provided a given minimum amount of bandwidth which is proportional to the weight. As long as this minimum has not been served, the queue is said to have a “positive credit”. Once this minimum amount is reached, the queue has a “negative credit”. • A queue can have either a “high” or a “low” priority. A queue having a “high” priority will be served before any queue having a “low” priority. • For each packet, the WRR algorithm strictly follows this queue service order: • High priority, positive credit queues; • Low priority, positive credit queues; • High priority, negative credit queues; • Low priority, negative credit queues. • The following explanation tries to clarify the WRR mechanism. • The positive credit ensures that a given queue is provided a minimum bandwidth according to the configured weight (for both high and low priority queue). On the other hand, negative credit queues are served only if one positive credit queue has not used its whole dedicated bandwidth and no more packets are present in a “positive credited” queue.
Juniper M10 – OC48 results • With the exception of a couple of glitches due to poor host performance, all the utilisation curves overlap with the ideal one for both Test 1 (2BE + 1LBE) and Test 2 (1BE + 2LBE) • Since a good link utilisation is not sufficient to have a good BW allocation precision, the per-BW allocation couple relative errors for both BE and LBE are presented in the next slide against different levels of port congestion.
Juniper M10 – OC48 results (cont.) • Apart from some glitches due to poor pc performances (measurement background noise), both BE and LBE error is negligible. • The operating region (through the M-LREW metric) is shown in the next slide.
Juniper M10 – OC48 results (cont.) apart from the shown glitch, the whole BW allocation set is a “max” operating region as expected.
Juniper M10 – GE • The IOS used was the same as for the OC-48 test - “Junos 5.3R2.4”. • the card version is 1x G/E, 1000 BASE-SX REV 01 • The iperf UDP-payload-level capacity C of the link, which is obtained by congesting the interface and not configuring qos is 957 Mbps. The card is therefore congested up to (957*2)/957= 200% of its capacity.
Juniper M10 – GE results • Again, due to the very good performance in terms of link Utilisation, we need to see • the relative BE and LBE BW allocation precision errors in order to see • whether there are errors and, if any, their magnitude and dynamics along the BW allocation couples and along the port congestion levels regions.
Juniper M10 – GE results (cont.) • BE error is negligible and mainly negative while the LBE error is mainly positive and is not negligible. • The LBE error decreases monotonically with the increase of the bandwidth allocation couples, this suggesting that the MAX LBE Relative error is monotone as well, as shown in the next slide.
Juniper M10 – GE results (cont.) The “interpolated” “max” operating region over the BW allocation couples ranges from 50-49 to 70-29.
Procket 8801 – OC48 • The System Release Version used is the 2.3.0.180-B • The Kernel Version used is the 2.3.0.1-P PowerPC • The card version is the 4-PORT OC-48c POS SR. • The iperf UDP-payload-level capacity C of the link, which is obtained by congesting the interface and not configuring qos is 2337 Mbps. The card is therefore congested up to (957*3)/2337=2871/2337= 122% of its capacity.
Procket 8801 – OC48/GE configuration sample • ! • qos • class BE • dscp 0 • class LBE • dscp 8 • service-profile GNEW2004 • class BE • class LBE • queuing-discipline dwrr (BE[X], LBE[Y], default[1]) • ! • interface output • qos-service GNEW2004 • !
Procket 8801 – OC48 results The link utilization is perfect and both BE and LBE show negligible errors (<1%). The interesting thing is that such errors appear from 80-19 towards 50-49 for both classes and that BE is actually positive while LBE is negative. The exact opposite error polarization if compared with the typical errors the other manufacturers show. The max operating region is not shown since it is evident that the whole BW allocation axis is a max. operating region!!!
Procket 8801 – 1GE • The System Release Version used is the 2.3.0.180-B • The Kernel Version used is the 2.3.0.1-P PowerPC • The card version is the 10-PORT 1000BASE-SX. • The iperf UDP-payload-level capacity C of the link, which is obtained by congesting the interface and not configuring qos is 957 Mbps. The card is therefore congested up to (957*3)/957=300% of its capacity. • It is worth noticing that this card is congested up to 300% (test1) of its capacity which is 100% more congested than the maximum congestion experienced by both GE Juniper and GE-WAN Cisco.
Procket 8801 – 1GE results The Link Utilisation is perfect. The BE relative errors are negligible and the LBE ones quickly tend to become negligible. The MAX LBE relative error with sign (M-LREWS) plotted against the BW allocation couples is presented in the next slide.
Procket 8801 – 1GE results (cont.) Apart from 98-1 and 96-3 all other couples show an error of less than 1%. A conservative “max” operating region though ranges from 95-4 to 50-49 over of the whole BW allocation couples axis.
Comparative analysis • As already highlighted, the majority of the errors are localised on LBE and therefore its relative error will be used to compare the performances of different routers. • In order to bound the operating region over the BW allocation couples axis, the M-LREWS (Max LBE Relative Error With Sign) metric is used for both GE and OC-48 and for all the three router manufacturer involved. The so-defined operating region is the “max. operating region”. • The M-LREWS metric allows the evaluation of the BW scheduler based solely on its worst performance over the port congestion level axis • This is of extreme importance since the bounded value for the precision in the allocation of BW that the manufacturers refer to can be correctly associated to the worst case scenario out of the whole offered load axis. It is therefore correct to say that an accuracy of 95% in the allocation of the BW is equivalent to have the M-LREWS/M-BREWS <= +-2.5% • In order, then, to further investigate the per-BW-allocation performance of a card over different card congestion levels, the AALRE (Average Absolute LBE Relative Error) metric is also presented • This metric allows quantifying how spread the error is over the port congestion level axis. • We refer to the so-defined operating region as the “avg” operating region, this highlighting that the method used to bound it was that of computing the AVG algebra for the relative errors. • The absolute values are used to avoid that the average of algebraic values could lead to a misleading ~0% errors as the effect of the cross-neutralisation of opposite polarised relative errors of the same order of magnitude.
Comparative analysis: OC-48 M-LREWS In order to work out which operating region applies to the different manufacturers, a zoom over the abscissa region where all the three curves are close to the value of 2.5% is presented in the next slide
Comparative analysis: OC-48 M-LREWS (cont.) • Apart from a glitch showed by Juniper (measurement background noise), the entire BW allocation couples axis is a “max” operating region for both Juniper and Procket with the latter performing slightly better. • It is difficult to determine a “max” operating region for Cisco as the error is not monotonically falling but it is oscillating around the value 2.5. As a consequence, a conservative “max” operating region over the BW allocation couple axis ranges from 75-24 to 50-49 (31.5%).
Comparative analysis: 1GE (M-LREWS) • With the target accuracy fixed to the canonical 95%: • Cisco “max” operating region, out of the whole BW allocation couples axis, ranges from 70-29 to 55-44 (21%). • Juniper “max” operating region, which is linearly interpolated out of the values obtained, ranges from 70-29 to 50-49 (26.3%) although its performance is better than the Cisco one throughout most of the bw allocation couples axis. • Procket “max” operating region ranges from 95-4 included to 50-49 (73.6%). • It’s worth highlighting that the Procket card was congested up to 300% of its capacity while only 200% was the maximum congestion that Cisco GE-WAN and Juniper GE experienced during the test.
Comparative analysis: OC-48 A-ALRE • Cisco OC-48 operating region averaged over the whole port congestion levels axis (“avg” operating region) ranges from 94 – 5 included to 50-49 (68.42%) . • It is worth noticing how the average lowers the values but also acts, in this case, as a low pass filter whose effect is that of smoothing out the oscillations that led before to a conservative evaluation of the Cisco “max” operating region and that was the main reason for such a poor performance evaluation. • The Cisco “avg” operating region is, in fact, much better than the “max” operating region which ranges from 75-24 to 50-49 (31.5%) . • The plot in the next slide zooms on Juniper and Procket in order to compare their performance
Comparative analysis: OC-48 A-ALRE (cont.) The zoom shows how the error is negligible for both although Procket shows again slightly better performance. The whole BW allocation axis is a “AVG” operating region for both Juniper and procket
Comparative analysis: 1GE A-ALRE • Again, the average performance of both Cisco GE-WAN and Juniper M10 GE are much better than their relative “max” performance proving that the error is not spread along the offered_load/port_congestion_levels axis • Cisco “average” operating region ranges from 75-24 included to 55-44 which is 26.3% of the BW allocation couple axis • In order to work out the “avg” operating region for both Juniper and Procket, a zoom is needed and is presented in the next slide
Comparative analysis: 1GE A-ALRE (cont.) The Procket “average” operating region ranges from 97-2 included to 50-49 (78%) while the Juniper interpolated “average” operating region ranges from 91-8 included to 50-49 (52.6%) .
Comparative analysis: Survey and percentage improvement OC-48 A comparison based on both errors is provided. The relative table along with the computation of the percentage improvement (delta ∆) in passing from the “max” to the “avg” operating region is presented for both OC-48 (this slide) and GE (next slide). The Cisco 117.2 % improvement indicates that the per-allocation LBE relative error is rather localised over the OC-48 congestion level axis
Comparative analysis: Survey and percentage improvement 1GE What is of particular interest is the improvement delta of 100% that Juniper experiences in passing from the “max” to the “avg” operating region if compared to the much poorer 6% delta improvement that Cisco shows. This suggests that the per-BW-allocation Cisco LBE relative error is much more spread and therefore serious all over the GE port congestion level axis if compared with that Juniper shows which is instead much more localised on fewer GE port congestion levels.
Conclusions • We benchmarked both OC-48 and GE cards for each single router manufacturer by looking at the • Link Utilisation • How the BE and LBE Relative errors change all over the BW allocation set axis and with an increasing level of port congestion. • This study highlighted how: • A good Link Utilisation is only necessary but not also sufficient to have a precise BW allocation • The study of the error dynamic per BW allocation couple and per port congestion level is thus necessary in order to evaluate if and where errors in the allocation of the minimum guaranteed BW are. • We chose to evaluate the performance of the cards based on an accuracy in the allocation of the BW of 95%. • This is equivalent to have the maximum LBE relative error with sign (M-LREWS) < +- 2.5%; for this reason it is called “max” operating region (over the BW allocation couples). • BE error is not taken into account as it is always almost negligible for any of the manufacturer’s card under test. • This result suggests that the main problem these cards encounter is that they are unable to reallocate the BE left-over BW to LBE with a narrower operating region available as a consequence.
Conclusions (cont.) • The major outcome of the tests is that • Procket shows the best performance for both cards. The OC-48 result is even perfect. • Cisco has got the worst performances of all three manufacturers and for both cards. • Juniper is very close in performance to Procket for the OC-48 but is very close to Cisco for the GE card. (see next point for further evaluation of the GE performances between Cisco and juniper) • A further analysis of the GE performance based on the percentage improvement (delta ∆) in passing from the “max” to the “avg” operating region shows how 100% and 6% are the delta improvements experienced by Juniper and Cisco respectively. • This suggests that the per-BW-allocation Cisco LBE relative error is much more spread and therefore serious all over the GE port congestion level axis if compared with that of Juniper which is instead much more localised on fewer port congestion levels.
Conclusions (cont.) • It is clear, for the three manufacturers, that the QoS implementation in the OC-48 line cards presents a much more precise formulation than that found for the GigE line cards. This suggests that raw speed may not be the main issue in the design of good bandwidth schedulers • It is however true that for the tests of the GigE line cards the level of over-commitment was greater than for the equivalent OC-48 line card tests, i.e. 3 * 1Gpbs over a 1Gbps link as opposed to 3 * 1Gbps over a 2.5Gbps link. This may be of significance but the test environment was the same for all line cards tested. • The fact that SONET employs a synchronous serial transmission while GigE uses an asynchronous serial transmission may also be of significance to these results • Finally, SONET is a much more mature technology operating at Gigabit rates in comparison with GigE and this may contribute in some way to the results presented