Adventures in CSE 3 Winter 2010: Presentation of Information with Word & PowerPoint
10 likes | 111 Vues
Explore the world of computer skills through CSE 3 course, featuring HTML, Excel, Scratch, Photoshop, and PowerPoint. Learn data analysis, game creation, web page design, and more.

Adventures in CSE 3 Winter 2010: Presentation of Information with Word & PowerPoint
E N D
Presentation Transcript
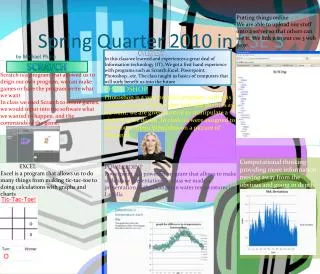
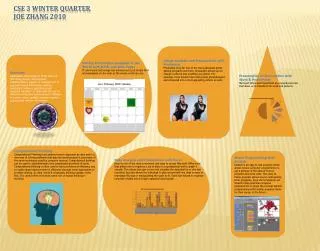
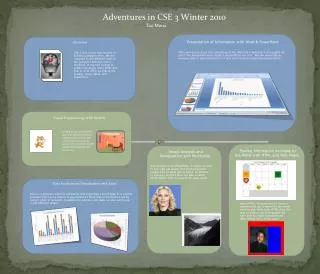
Adventures in CSE 3 Winter 2010 Tao Moua Presentation of Information with Word & PowerPoint Overview After working on Excel and calculating all the data and organizing it into graphs we put it into PowerPoint and created a presentation out of it. We this presentation we were able to add animations to it and turn it into a presentable presentation. CSE 3 is a course that focuses on building computer skills. We are exposed to the different parts of the computer and also how it functions. It teaches us how to create web pages using HTML and how to work other programs like Scratch, Excel, Word, and PowerPoint. Visual Programming With Scratch Scratch is a program which allows students to combine different functions already n the program and create games. In Scratch we created games like ping pong and tic-tac-toe. Making Information Available to the World with HTML and Web Pages Image Analysis and Manipulation with Photoshop With programs like PhotoShop, it taught us how to turn ugly old people into young beautiful people without gaps and wrinkles. In addition to fixing up people’s faces we also created an animation from 2 pictures 50 years apart. Data Analysis and Visualization with Excel Excel is a program used for computing and organizing a lot of data. It is a great program that I got a chance to use because I think that in the future I will be using it often in research. In addition to working with data, we also got to put it into different graphs. Using HTML, we were able to create a calendar and put it online for the whole world to see. With basic HTML skills like tags and other secret language, we were able to create calendars and other things like a home page!