Download
1 / 23
230 likes | 342 Vues
Global Ocean Heat Content 1955-2007 in light of recently revealed instrumentation problems. Ocean Climate Laboratory National Oceanographic Data Center- NOAA XBT Drop-rate Meeting March 10, 2008 Miami, FL. Syd Levitus, John Antonov, Tim Boyer. Conclusions.

E N D
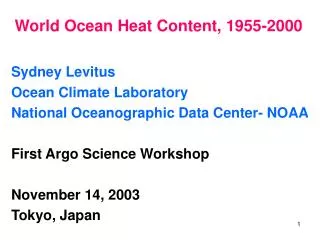
Global Ocean Heat Content 1955-2007 in light of recently revealed instrumentation problems Ocean Climate Laboratory National Oceanographic Data Center- NOAA XBT Drop-rate Meeting March 10, 2008 Miami, FL. Syd Levitus, John Antonov, Tim Boyer
Conclusions • We agree with Gouretski & Koltermann (2007) and others that there is a systematic, time-varying bias with XBT data; • We agree that the introduction of corrections for this XBT bias reduces the amplitude of the interdecadal variability observed in our previous ocean heat content results; • We do not agree that the XBT bias corrections affects the long-term trend (1955-2007) in ocean heat content that we previously reported.
Yearly heat content by ocean basins, 0-700m layerLevitus et al., 2005
Yearly mean temperature difference between XBT and CTD/OSD data after Gouretski and Koltermann (2007)
ESTIMATION of XBT CORECTIONS • Temperature observations were interpolated to standard depth levels • Seasonal signal was reduced by subtracting the monthly climatology from observations • These anomalies were averaged within 4° LONG x 2° LAT squares at standard depth levels for each year to produce yearly mean XBT and CTD/OSD anomalies • The median of all 4x2 differences between XBT and CTD/OSD was computed at each standard depth level and year
Median rather than Mean should be used because the median is resistant to outliers
GK2007 bias compared with median estimate The figure below left shows the GK2007 XBT “bias” correction as a function of time compared with the OCL correction. Note the extreme values in the GK2007 results which are difficult to believe. The figure below right shows the number of 4x2 boxes that meet the observation criteria as a function of time for both MBT and XBT comparisons based on OCL computations.
Percent Ocean Volume (0-700 meters) covered by profile data by year
Geographical bias of the correctionsPercent ocean area of 2-degree zonal belts with 4 Long x 2 Lat differences between XBT and CTD/OSD pairs at 50 m depth
World Ocean: Median difference between MBT & CTD/OSD (>=30 4x2 boxes with >= 3 obs.) As shown in a previous slide there are very few MBT-CTD/OSD pairs after 1990 which is why our new ocean heat content estimates do not use MBT data after 1990. The presence of a shallow subsurface maximum in the above difference field suggests differences in either MBT thermistor and/or pressure sensing elements as compared to CTDs and reversing thermometers.
Reanalysis • XBT and MBT observations were bias corrected. • XBT data below 700 m depth were excluded. • MBT data after year 1990 were excluded. • Subset of PFL data with pressure offset problem was excluded. • All instrumental types of data were used to compute the objectively analyzed temperature anomaly fields.
Linear trend estimates of World Ocean Warming1022 J/year 0-700 m layer Levitus et al. (2005) 1955-2003: 0.210.23 1955-2007:0.24 1968-2007:0.35 1993-2007:0.73 ------------------------------------------------------------------------------- 0-1500 m layer 1955/59-2003/07:0.38 1968/72-2003/07:0.46 1993/97-2003/07:1.13 ------------------------------------------------------------------------------- 0-3000 m layer 1955/59-1994/98: 0.31 0.33
Comparison of 3 SST climatologies Is there enough data to produce reasonable estimates of upper ocean heat content? A comparison between global SST time series from NCDC and the UKMO Hadley Centre based on > 130 million SST observations from ICOADS and the global SST time series based on WOD05 (7.9 million SST obs.) show excellent agreement. Of course we continue adding additional historical as well as modern data to reduce uncertainty in our estimates.
Conclusions • We concur with Gouretski & Koltermann (2007) that there is a systematic • time-varying bias with XBT data; • We concur that the introduction of corrections for this XBT bias reduces the • amplitude of the interdecadal variability observed in our previous ocean • heat content results; • However, the XBT bias correction does not affect the long-term trend in • ocean heat content that we previously reported.
Recommendations-1 The corrections for the XBT drop-rate problems are empirically determined by comparing XBT observations with those from CTDs and reversing thermometers. This means that as the number and/or distribution of XBT-thermometer pairs or XBT CTD pairs change the XBT ”bias” correction could change. No changes should me made to original XBT data. The corrections which P.I.s apply to XBTs should be made available with the publication of any scientific work. Even if we find some systematic error in manufacturing etc. the corrections to XBT data should not be made to the original data. This is the present recommended policy with the XBT drop-rate problem as discussed by Hanawa et al. ( 1995 ). This is because our “correction” may be modified in the future. Acquiring additional historical as well as modern CTD and Bottle data is critical for improving the estimates of time dependent XBT biases. XBT-CTD comparisons should be done at least every year
Reccommendations-2 Follow the “GCOS Climate Monitoring Principles” Effective monitoring systems for climate should adhere to the following principles* (pdf): (* The ten basic principles (in paraphrased form) were adopted by the Conference of the Parties (COP) to the United Nations Framework Convention on Climate Change (UNFCCC) through decision 5/CP.5 at COP-5 in November 1999. This complete set of principles was adopted by the Congress of the World Meteorological Organization (WMO) through Resolution 9 (Cg-XIV) in May 2003; agreed by the Committee on Earth Observation Satellites (CEOS) at its 17th Plenary in November 2003; and adopted by COP through decision 11/CP.9 at COP-9 in December 2003.) 1) The impact of new systems or changes to existing systems should be assessed prior to implementation. 2) A suitable period of overlap for new and old observing systems is required. 3) The details and history of local conditions, instruments, operating procedures, data processing algorithms and other factors pertinent to interpreting data (i.e., metadata) should be documented and treated with the same care as the data themselves. 4) The quality and homogeneity of data should be regularly assessed as a part of routine operations. 5) Consideration of the needs for environmental and climate-monitoring products and assessments, such as IPCC assessments, should be integrated into national, regional and global observing priorities. 6) Operation of historically-uninterrupted stations and observing systems should be maintained. 7) High priority for additional observations should be focused on data-poor regions, poorly observed parameters, regions sensitive to change, and key measurements with inadequate temporal resolution. 8) Long-term requirements, including appropriate sampling frequencies, should be specified to network designers, operators and instrument engineers at the outset of system design and implementation. 9) The conversion of research observing systems to long-term operations in a carefully-planned manner should be promoted. 10) Data management systems that facilitate access, use and interpretation of data and products should be included as essential elements of climate monitoring systems.