Download
1 / 37
460 likes | 769 Vues
Lecture on Local Government and Public Goods. Based on Chapter 19 in Urban Economics by Arthur O’Sullivan, 5 th edition Adapted and summarized by Austin Troy, University of Vermont. What is the role of government?.

E N D
Lecture on Local Government and Public Goods Based on Chapter 19 in Urban Economics by Arthur O’Sullivan, 5th edition Adapted and summarized by Austin Troy, University of Vermont
What is the role of government? • Stabilization: monetary and fiscal policy used to control unemployment and inflation • Redistribution: Taxation and transfers used to remedy inequities • Resource allocation: makes production decisions either directly (e.g. through municipal utility) or indirectly (e.g. through subsidies or taxes on allocations). • See Musgrave and Musgrave (1980)
Local Government • Does not have the responsibility of fiscal stabilization for obvious reasons • Does not have redistributive role because of mobility of citizens. Poor will immigrate and rich will emigrate to other city • Both of these roles are better filled by national government • Local government primarily fills third role
When does local government intervene in resource allocation? • Provides goods produced under natural monopoly conditions • Provides goods that generate positive externalities • Provides public goods
Externalities • Represent a “market failure” • Where one person or firm’s consumption of a good creates benefits or costs for others • Individual makes a personally efficient decision (I.e. consumes until MB=MC) but externality causes there to be a social cost or benefit that is not considered; socially inefficient • Causes divergence between private and social benefits and/or costs • The cost or benefit is not “internalized” by producer
Positive Externalities (e.g.education) Marginal social benefit E’=how much market would provide E*=socially optimal amount Marginal private benefit Marginal cost Subsidy amt E’ E*
Negative Externalities (e.g. pollution) P’=pollution produced in private market P*=optimal pollution amount K=amount of externality Marginal social benefit Marginal social cost K Marginal private cost Marginal private benefit P* P’
Natural Monopoly • Where production of a good subject to large scale economics: that is, very big fixed costs, so those costs don’t get paid off until the scale of operation gets very large • Natural monopolies have decline average costs throughout their range of production • Private firms would underprovide service because high scale economies mean that average cost> marginal cost • Marginal cost pricing means operates at loss • City must step in and make up deficit
Natural Monopoly in Bus Service MR Demand= Marginal social Benefit P’ LRAC deficit P* LRMC Government sets this price Quantity S’ S*= optimum
Natural monopoly • In absence of regulation, firm produces S’ and receives a price of P’ • Problem is that firm producing at optimal point (S*) will lose money because D curve shows people not willing to pay that much • But there is a social cost to not having enough bus service, so to get residents to buy the socially optimal amount, P must be lower than market price; locality subsidize this difference • If set at P*, then socially optimal amount of S* is demanded. • Because falls below Av Cost, government must make up the difference, equal to rectangle
Why Marginal Pricing? If profit = TR-TC, then want to produce where distance between two is maximized, which is where the slopes, or marginal values are the same P TR p TC Q
In natural monopoly the range where people are willing to pay is in the downward sloping area Normally MC=MR occurs where MC>AC but in Natural Monopoly large scale economies means one firm can set price higher and quantity lower that social optimum Marginal and Average Price • Normally looks like this: MC gets bigger than AC P MC AC Q
Public Goods Provision • Local governments provide goods that the market cannot provide either because they cannot price it, charge for it, or exclude
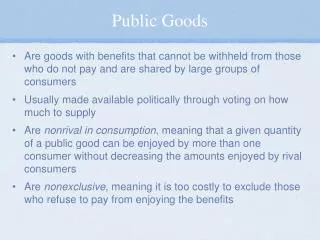
Public Good Characteristics • Nonrivalrous: can be consumed by many at once, such as clean air • Pure local public is were MC of additional user=0; does not decrease other’s utility • Semi-rivalrous: where is non-rivalrous at small amounts or at certain times but not at others • E.g. streets may be non-rivalrous at certain times of day but not others
Public Good Characteristics • Nonexcludable: impossible/impractical to exclude any from consuming • Examples: Defense, air waves, other examples? • Hard to charge for the service • Can’t tell who is willing to pay and who is not, who is benefiting and who not • Some are non-excludable by choice, because alternative would be inequitable • Examples fire service
Pure and Partial Public Goods • A common situation is that goods are non-rival at smaller usage levels, but rivalrous at large usage levels • Example: with a park, an additional household’s use does not diminish anyone’s enjoyment, until you reach carrying capacity C at which point each marginal user does impose additional costs
Local Public Goods • These are public goods where the benefit is confined to a contained geographic area, like a city. • Ideally, the size of jurisdictions would be determined by the level of “localness” of the public goods being provided • The more extensive the benefits, the larger the jurisdiction needed to internalize those
Why provide certain public goods at the local level? • Wallace Oates (1972) proposed three criteria: • Diversity of Demand: “one size fits all” vs. local diversity of preferences • Externalities/spillovers: are external effects locally contained or do they spill over? • Scale economies: higher levels of government can leverage bigger scale economies • The test for local provision of a public good is whether 1 outweighs 2 and 3
Tradeoff 1: Scale Economies v. Diversity of Demand • Assume 1 public good (library service) and two municipalities in metro area • High Demand in city H and low in L • No externalities/spillovers between towns • Scale economies: regional library can produce unit “literary services” cheaper than local library • Identical services in towns
Who should make library allocation? • If towns merge and form metro government, pool resources to build bigger library system, then good news is that cost/ unit service is lower, but bad news is that L is paying for more library service than they want and H is getting less library services/person than it had before. • Only efficient to merge if savings due to scale economies are large relative to losses in efficiency from the uniformity of service provision
Empirical Results • Moderate scale economies in things like sewer and water provision, because capital intensive • Police, fire and schools, have scale economies (gains to scale) occurring until about 100,000 people, at which point fewer gains to consolidation • Some areas have regional government entities that provide services with large scale economies
Tradeoff 2: Externalities vs. Demand Diversity • Where service creates positive externalities that spill over into other jurisdictions, it will be underprovided, because they consider the costs but, not all the benefits • Inefficiency occurs because boundaries of jurisdiction is too small to contain benefits
Example: Water pollution • Town X in the Champlain Valley will underprovide stormwater management services (unless mandated) because benefits are realized by all Lake Champlain users, and they only consider local benefits
Example: Parks Provision • Cities will tend to underprovide parks, because only consider benefits to local residents, when their parks could potentially be important resource for people regionally • However, if a regional government takes over and DD is high, there will be too many parks for certain types of people and too few for others
Diversity of Demand and Spillovers If externalities small, S’ will be close to S*, M’ close to M*, etc. Then, municipal decisions are efficient. This is reinforced if DD is very large and S* is far from M* etc. Town M: medium parks Town L: large parks Town S: small parks MSB(l) MSB(s) MSB(m) MLB(l) MLB(s) MLB(m) S’ S* M’ M* L’ L*
Tradeoffs in level of PG provision: summary • If DD is large relative to scale economies or spillovers, local is better • If spillovers or scale economies are large relative to DD, then regional is better • In previous slide, gaps between individual demanders are greater than gaps between MSB and MLB, so local provider is better
Examples • Which category do these services fall into and why? • Flood control • Structural fire protection • Wildfire protection • Air quality • University system • Highway patrol
How much of a public good should a city provide? • Park example: how big to make it? • Assumptions: decisions made by majority rule, three-person city, no congestion, no spillover benefits • Efficient amount: where MB of additional acre equals MC • To get MB we add up everyone’s demand curves, which represent WTP
How big should park be? Cost/acre Marginal social benefit= MB1+MB2+MB3 Ideal amount is 70 acres MC $60 MB curves for three citizens MB1 MB2 MB3 70 acres Here WTP > MC of additional acre Here WTP < MC of additional acre
Methods for determining the amount of local public good • Benefits taxation: ideal, but impractical • Median voter: practical and common, but inefficient • Household mobility and sorting: practical and efficient under some conditions, but not necessarily equitable. We’ll talk about this after Spring Break
Benefit taxation • Tax people on their WTP for the optimum size of the good (e.g. park) ; the greater the WTP, the greater the tax • This will yield optimum amount of the park, even if population is heterogeneous • Impractical because must know shape of everyone’s demand curves and because there is no incentive for taxpayers with high WTP to reveal that willingness
Median Voter Approach • Assuming there is no interjurisdictional mobility • Often such decisions made through vote • Will efficient size be chosen? • No, not when charged by benefits taxation • This is because the Q will be chosen where the median voter’s private MB= marginal private cost, or tax • MC= $60/acre so each citizen pays $20/acre
Park provision under voting Cost/acre Marginal social benefit= MB1+MB2+MB3 Marginal social cost $60 MB1 Marginal private cost MB2 $20 MB3 10 55 70 acres 115
Median voter rule • In election between 115 and 55 acres, 55 would win because person 3 and person 2 would vote for it. In election between 10 and 55, 55 would win because person 1 and person 2 would vote for it. • Where spending level vs. service is being voted on the median voter’s desired outcome gets the most votes. • Inefficient because everyone pays equally, but some want it more than others • The magnitude of persons 1 and 2’s preferences don’t matter because median will always win
How do growth controls fit into this? • Growth controls are another way for controlling the amount of public services provided by a municipality and the average cost to residents • It is also a way of preventing transfers of wealth from existing residents to new.
Inflation and Services • Imagine a community of 100 people and $10,000 repayment cost for municipal facilities= $100/household • Now another 100 move into town; without inflation, all are equal. • But with inflation, the nominal cost of the new infrastructure goes up to $20,000 for the same amount, which equals $200 per new resident. • But that new burden must be shared equally, so everyone pays $150. Old residents are worse off • Because new residents pay less than marginal cost, too many move to municipality and resource is congested • Problem: no transparent means for charging marginal cost • Old way (and Prop 13 in CA): limit reassessments on houses of long-time residents; only reassess for transfer. From Fischel chap 15
Inflation and services • Strong motivation for growth controls when inflation • The big question is: do the additional nominal costs of new development outweigh the benefits of increased economies of scale in service provision? • Keep in mind that this only applies to fixed capital cost services, not variable cost items, like salaries of teachers • Also, there are devices for recovering some additional costs from new residents, like exactions and impact fees • Fischel: key goal is to eliminate fiscal incentive to exclude by state aid to moving in of new people • Reduce reliance on property tax to finance local services • Unintended consequence of inclusionary zoning is it gives incentive for wholesale exclusion of all development. • Perhaps then inclusionary zoning is a ruse by many communities to give appearance of complying with law while being able to exclude fully. • How does Act 60 fit in? From Fischel chap 15