Download

1 / 32
320 likes | 567 Vues
Multilevel Modeling in Cardiac Drug Utilization Research. Outline. PROC GLIMMIX introduction Cardiac drug utilization research using multilevel models. Multilevel data. Multilevel data are common in observational study in social science, health care field.

E N D
Outline • PROC GLIMMIX introduction • Cardiac drug utilization research using multilevel models.
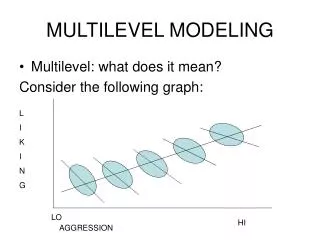
Multilevel data • Multilevel data are common in observational study in social science, health care field. • Clinical trials carried out in serveral random selected center or groups of subjects create data hierarchies
The Research Question Investigate clinical and non-clinical factors associated with prescription of cardiac drugs for patients discharged after catheterization.
Inclusion/Exclusion Criteria • Include All patients underwent the 1st CATH from 1999/07 to 2002/10 • Exclude patients with age<20, non-BC patients, prior CABG or PCI, in hospital death, discharged to extended care • Exclude patients with normal angiogram
Drugs of interests • ACE Inhibitor • Beta Blocker • Statin • Optimum drug
Factor of Interest • Patient level: sex, age, extent of disease (blockage), prior drug, ejection fraction, prior MI, DM, renal, HPD, HTN, PVD, CVA, CHF, COPD, liver disease, urgency, indication, cardiac re-hospitalization, transfer history, length of hospital stay, revascularization, • Hospital level: teaching hospital • Physician level: year of service, volume of service • Neighbourhood level: Median family income, univeristy education rate, immigration rate
Assumption 1st Catheterization 120 days Discharge Admission
Data Structure The data set consists 22847 patients • Hospital level: Patients discharged from 67 BC hospitals with hospital cluster size from 1 to 4403 patients; 97% patients discharged from hospital with cluster size>100. • Physician level: Patients discharged by 1059 physicians (with anywhere between 1 to 785); 72% patients discharged by physician with cluster size >100). • Census tract level: Patients came from 695 census tract with census tract cluster size from 1 to 342, 73% patients came from census tract with cluster size>30.
Hospital Physician Neighbourhoods Data Structure Patient
Cross random intercept model yi ~ Bernouilli ( πi ) Logit(πi) = β0i + β1 x1i β0i = β0 + δhosp(i)(2) + δdoc(i)(3) + δtract(i)(4) Where i indexes the patient i, and hosp(i), doc(i), and tract(i) are functions that return the unit number of the hospital, doctor, and census tract, respectively, that patient i belong to.
Cross random intercept model yi ~ Bernouilli ( πi ) Logit(πi) =β0 + β1 x1i + δhosp(i)(2) + δdoc(i)(3) + δtract(i)(4) δhosp(i)(2) ~ N (0, σδ(2)2 ) δdoc(i)(3) ~ N (0, σδ(3)2 ) δtract(i)(4) ~ N (0, σδ(4)2 )
Allow coefficient to vary across the classification • Suppose β1i represent heart failure, we want to know whether the impact of heart failure vary across the hospital classification, we would use cross random coefficient model to investigate that.
Cross random coefficient model yi ~ Bernouilli ( πi ) Logit(πi) = β0i + β1i x1i β0i = β0 + δhosp(i),0(2) + δdoc(i)(3) + δtract(i)(4) β1i = β1 + δhosp(i),1(2) Where δhosp(i),0(2) and δhosp(i),1(2) representing the hospital random intercept effects and random slope effects, respectively.
Where to get proc glimmix • The glimmix procedure is a new procedure in SAS/STAT software. It is an add-on for the SAS/STAT product in SAS 9.1 on either the Windows or Linux platform. It is currently downloadable for the SAS 9.1 release from software downloads at support.sas.com.
Two level glimmix procglimmix data=glim_dataF IC=Q; class sex ageGP65 dis_hosp ; model drug(event='YES')=sex ageGP65/solution dist=binary link=logit ddfm=bw oddsratio; random int / subject=dis_hosp; run;
Three level glimmix procglimmix data=glim_dataF IC=Q; class sex ageGP65 dis_hosp dis_phy; model drug(event='YES')=sex ageGP65/solution dist=binary link=logit ddfm=bw oddsratio; random int / subject=dis_phy(dis_hosp); run;
Order in the class statement Value of ORDER= Levels Sorted By DATA order of appearance in the input data set FORMATTED external formatted value, except for numeric variables with no explicit format, which are sorted by their unformatted (internal) value FREQ descending frequency count; levels with the most observations come first in the order INTERNAL unformatted value
Proc glimmix • Advantage • Allows multiple random effects, nested and crossed random effects • Allows subject-specific and population-averaged inference • Allows nonnormal distribution of response • Disadvantage • The absence of a true log likelihood • The computation of cross effects model is time consuming
Upcoming features in proc glimmix in SAS 9.2 • The COVTEST statement for likelihood-based testing and confidence intervals for covariance parameters. • Better output format?
Effects of ignoring Nested Structure • Ignoring the hospital hierarchy leads to inflation of physician variance estimates drasticly • Adding the cross effect of census tract on hospital-physician nested hierarchy doesn’t change the hospital and physician variance.
Does Teaching hospital help to explain the variation at hospital level? Cross effects model
Does Teaching hospital help to explain the variation at hospital level? • Teaching hospital effect does not explain the variation at hospital level • Service years of physician and physician service volume only explain very little of the variation at physician level
ACE Inhibitor single level LR vs. multilevel LR 1st row:: Single level LR results 2nd row: multilevel LR results
Beta Blocker single level LR vs. multilevel LR 1st row:: Single level LR results 2nd row: multilevel LR results
Statin single level LR vs. multilevel LR 1st row:: Single level LR results 2nd row: multilevel LR results
Optimum Rx single level LR vs. multilevel LR 1st row:: Single level LR results 2nd row: multilevel LR results
Implication of the results • Compared to the cross effects models, the standard errors of teaching hospital effect from the single-level logistic regression are much smaller and lead to an invalid finding of significant teaching hospital effect. • Between census tract variance is fairly small. We keep the census tract random effects in the model as we want to examine the influence of immigration rate on drug utilization.
Reference • Judith D.Singer. Using SAS PROC MIXED to fit multilevel models, Hierarchical models, and individual growth models. Journal of Educational and Behavioral Statistics 1998; 24, 323-355 • Jone Rasbash , William Brown. Non-hierarchical multilevel models. • Tony Blakely, S V Subramanian. Multilevel Studies. In Oakes M, Kaufman J, eds, Methods for social epidemiology, Jossey Bass: San Francisco. 2005: in press.