Download
1 / 17
170 likes | 303 Vues
This report presents the 2011 water quality data for various lakes in Citrus and Hernando Counties, highlighting total nitrogen, phosphorus, chlorophyll levels, and the Trophic State Index. Lakes with consistent sampling include Bellamy, Cooter, and Croft, while others like Bradley and Cato showed less consistency. Most lakes exhibited good to fair water quality, with low risks of algae blooms. The data emphasizes the importance of continuous monitoring for maintaining safe water conditions and guiding restoration efforts.

E N D
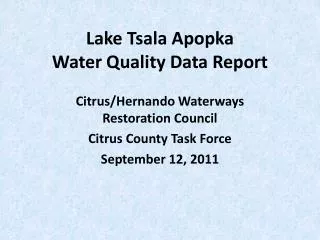
Lake Tsala Apopka Water Quality Data Report Citrus/Hernando Waterways Restoration Council Citrus County Task Force September 12, 2011
Lakes with the most consistent sampling frequency Bellamy Cooter Croft Dodd Floral City Ft. Cooper Hampton Henderson Hernando Little (Consuella) Little Henderson Spivey Todd
Lakes with the least consistent sampling frequency Bradley Cato Davis Magnolia Point Lonesome Tussock Van Ness
Total Nitrogen, 2011 Average • <1 mg/L – Good conditions, low risk of water quality degradation • 1-1.5 mg/L – Fair conditions, within seasonal averages • >1.5 mg/L - System may be prone to sudden reductions in water quality, algae blooms
Total Nitrogen, 2011 Average • Bellamy - 1.10 • Bradley - 1.34 • Cato - 0.78 • Cooter - 0.46 • Croft - 1.11 • Davis - 1.01 • Dodd - 1.14 • Floral City - 1.07 • Fort Cooper - 0.98 • Hampton - 0.99 • Henderson - 0.97 • Hernando - 1.02 • Little (Consuella) - 0.83 • Little Henderson - 0.96 • Magnolia – No Data • Point Lonesome - 1.50 • Spivey - 0.97 • Todd - 1.12 • Tussock - 1.09 • Van Ness - 1.14
Total Nitrogen, 2010 Average • Bellamy - 1.20 • Bradley - 1.72 • Cato - 1.61 • Cooter - 0.42 • Croft - 1.34 • Davis - 1.55 • Dodd - 1.27 • Floral City - 1.41 • Fort Cooper - 1.11 • Hampton - 1.39 • Henderson - 1.36 • Hernando - 1.30 • Little (Consuella) - 0.80 • Little Henderson - 1.30 • Magnolia - 0.63 • Point Lonesome - 1.43 • Spivey - 1.49 • Todd - 1.26 • Tussock - 1.33 • Van Ness - 1.37
Total Phosphorus, 2011 Average • <0.05 mg/L – Good conditions • 0.05-0.1 mg/L – Fair conditions, within seasonal averages • >0.1 ug/L - System may see a rapid increase in algal growth
Total Phosphorus, 2011 Average • Bellamy - 0.019 • Bradley - 0.024 • Cato - 0.058 • Cooter - 0.025 • Croft - 0.015 • Davis - 0.022 • Dodd - 0.017 • Floral City - 0.033 • Fort Cooper - 0.011 • Hampton - 0.032 • Henderson - 0.019 • Hernando - 0.017 • Little (Consuella) - 0.027 • Little Henderson - 0.018 • Magnolia – No data • Point Lonesome - 0.028 • Spivey - 0.020 • Todd - 0.016 • Tussock - 0.045 • Van Ness - 0.015
Total Phosphorus, 2010 Average • Bellamy - 0.019 • Bradley - 0.037 • Cato - 0.097 • Cooter - 0.027 • Croft - 0.014 • Davis - 0.035 • Dodd - 0.016 • Floral City - 0.056 • Fort Cooper - 0.011 • Hampton - 0.054 • Henderson - 0.027 • Hernando - 0.016 • Little (Consuella) - 0.019 • Little Henderson - 0.022 • Magnolia - 0.018 • Point Lonesome - 0.035 • Spivey - 0.034 • Todd - 0.016 • Tussock - 0.059 • Van Ness - 0.016
Total Chlorophyll, 2011 Average • <15 ug/L – Good conditions, low incidence of algae • 15-30 ug/L – Fair conditions, within seasonal averages • >30 ug/L - System may become low in oxygen, low in light penetration
Total Chlorophyll, 2011 Average • Bellamy - 5.42 • Bradley - 12.30 • Cato - 14.99 • Cooter - 4.38 • Croft - 5.17 • Davis - 3.84 • Dodd - 6.46 • Floral City - 12.18 • Fort Cooper - 1.58 • Hampton - 15.71 • Henderson - 5.43 • Hernando - 6.05 • Little (Consuella) - 6.88 • Little Henderson - 5.80 • Magnolia – No Data • Point Lonesome - 8.10 • Spivey - 5.93 • Todd - 5.67 • Tussock - 19.84 • Van Ness - 3.27
Total Chlorophyll, 2010 Average • Bellamy - 6.66 • Bradley - 26.71 • Cato - 8.89 • Cooter - 3.68 • Croft - 5.97 • Davis - 21.39 • Dodd - 9.06 • Floral City - 12.72 • Fort Cooper - 1.59 • Hampton - 19.20 • Henderson - 17.23 • Hernando - 9.07 • Little (Consuella) - 6.07 • Little Henderson - 15.23 • Magnolia - 2.57 • Point Lonesome - 15.63 • Spivey - 33.95 • Todd - 7.74 • Tussock - 26.58 • Van Ness - 4.75
Trophic State Index, 2011 Average • 0 – 50 – Good conditions, low risk of algae blooms • 50-70 – Fair conditions, water quality may be degraded • 70+ - System is experiencing trophic collapse, fish kills and algae blooms may occur
Trophic State Index, 2011 Average • Bellamy - 42.5 • Bradley - 46.7 • Cato - 51.5 • Cooter - 34.0 • Croft - 39.2 • Davis - 39.5 • Dodd - 42.9 • Floral City - 50.7 • Fort Cooper - 26.2 • Hampton - 54.7 • Henderson - 42.6 • Hernando - 42.5 • Little (Consuella) - 46.5 • Little Henderson - 42.0 • Magnolia - No Data • Point Lonesome - 46.4 • Spivey - 43.4 • Todd - 40.1 • Tussock - 57.0 • Van Ness - 35.6
Trophic State Index, 2010 Average • Bellamy - 43.1 • Bradley - 54.6 • Cato - 58.3 • Cooter - 37.3 • Croft - 39.0 • Davis - 53.0 • Dodd - 42.9 • Floral City - 53.2 • Fort Cooper - 26.8 • Hampton - 54.1 • Henderson - 50.4 • Hernando - 42.8 • Little (Consuella) - 42.9 • Little Henderson - 49.9 • Magnolia - 37.4 • Point Lonesome - 51.9 • Spivey - 52.4 • Todd - 42.5 • Tussock - 58.1 • Van Ness - 38.8
Conclusions • Data for all lakes was well within state standards (where applicable) • Water Quality in 2011 so far is much better than in 2010 in most locations • Historically, water quality increases as you move south to north. But with nutrient data it appears that the Nitrogen levels in the Inverness has been better than the Hernando Pool.