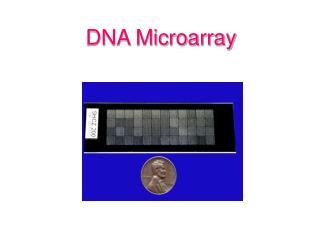
The Pat Brown DNA Microarray Chip
The Pat Brown DNA Microarray Chip. cDNA Microarray Technology . - first developed by Pat Brown and colleagues at Stanford University -developed for high-throughput measurement of expression patterns of thousands of genes -simplest realization of this technology is the. spotted DNA microarray.


The Pat Brown DNA Microarray Chip
E N D
Presentation Transcript
cDNA Microarray Technology -first developed by Pat Brown and colleagues at Stanford University -developed for high-throughput measurement of expression patterns of thousands of genes -simplest realization of this technology is the spotted DNA microarray
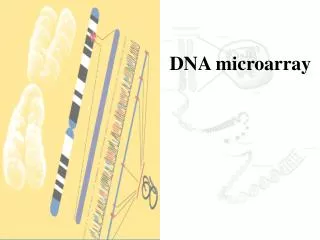
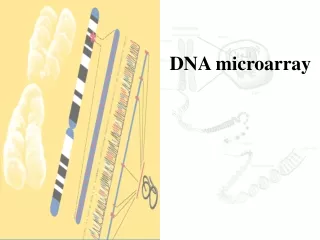
What is a cDNA microarray? A set of cloned cDNAs spotted on a membrane or a glass slide, and hybridized to labeled RNA or DNA
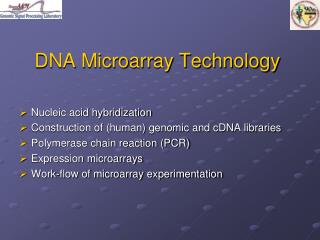
How it works 1) High speed, high precision robot is used to spot thousands of DNA samples onto glass slides
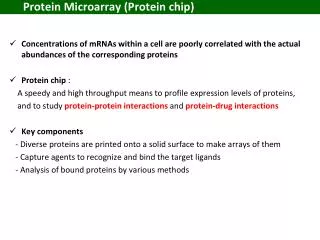
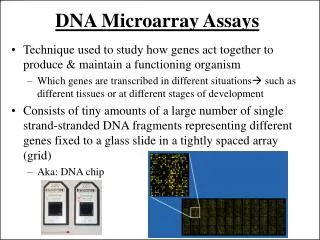
Goal: to measure gene expression • by measuring the number of RNA messages (mRNAs) being produced for each gene. • To measure mRNA messages, the spotted cDNA fragments represent the distinct genes to be measured. • These will selectively hybridize with their associated mRNA (or cDNA) made from a test sample of cells or tissue, and thus can give a measurement of expression of these target genes in sample.
I. Printing DNA Microarrays • The DNA fragments to be arrayed (spotted) are first amplified by PCR to get sufficient quantity • The reactions should largely yield single bands in the 400—2000 bp size range • Plain glass microscope slides are either coated with silane-derivative or with poly-L-Lysine to give the surface DNA binding capacity
Preparing Print Tips for Printing • Robotic Printing • The “print tip” is a needle-like steel pin with a split tip that takes up several hundred nanoliters of fluid by capillary action
The tip dips into a well, takes up DNA solution, and then releases a nanoliter sized drop each time it is touched down on a slide. • The droplet dries in a few seconds, leaving the DNA spot behind as a “stain” • The spots are laid on the slides in a rectangular grid pattern.
10 000 gene array could be completed in a single 13 hour printing run, yielding on the order of 100 printed arrays. This level of speed typically requires 32 print tips.
Post-Processing of Slides: • UV crosslink DNA to glass • Chemically treated to “finish” the surface i.e. bind the DNA and make the surface non-sticky so that it does not non-specifically bind labeled DNA during the later hybridization. • Return plates to –20C for long term storage. Plates can typically be arrayed from 2-4 times
II. Simple Probe Preparation and Hybridization • Total RNA and mRNA from tissues or cell lines is extracted and purified • Labeling is carried out by performing reverse transcription of the RNA in the presence of dye-labeled nucleotides • resulting cDNA copy has incorporated fluorescently labeled bases • the red (Cy5) and green (Cy3) labeled probes must be produced in separate labeling reactions so that each incorporates one color of dye
Hybridization: • Red and green labeled probe reactions are combined • “Blocking DNA” added and then applied to the surface of the DNA slides (repetitive and non-specific DNA fragments, to block such hybridization sites on the array before they can attach to labeled probe fragments, Poly-A fragments) • microscope cover slip is applied to spread the solution uniformly over the array and prevent rapid evaporation
Hybridization: about 8—16 hours suffices to produce a reasonable amount of appropriate hybridization • The slide is washed to remove buffer and unhybridized probe DNA
Data Processing The finished slide is scanned by a fluorescent scanner.
Scanners • Confocal Microscopy Scanners: The most common approach is to scan across the slide with a laser that is tuned/filtered to predominantly excite a single dye • CCD Camera “Scanners”: An alternative approach is to simultaneously excite both dyes over the entire slide surface with bright white tungsten filament light (no lasers)
Images must be quantified numerical measurements of the brightness of the spots Normalization -subtract background -adjust for variable DNA -adjust for variable amounts of green and red dyes Ratio red:green intensity
Applications • Identify critical genes to target in viruses and bacteria • Functional relations among genes (assign function to genes) • Clue to specific physiological processes in an environment (how are cells surviving) • Where a gene product is produced (in which cell) • Molecular picture of physiological processes
Analysis of virulence potential of E. coli strains isolated from clinical samples (A) genomic DNA from avian E. coli isolate (B) hybridization pattern obtained with genomic DNA from bovine strain (C) hybridization obtained with genomic DNA from human E. coli isolate Boxed spots indicate pathotype-specific genes
Application: -Protein needed for cell function -Location for protein function -Cells to target for drug therapy -Genes to target for drug therapy
Gene expression probing using cDNA microarray revealed genes downregulated transcriptionally with metabolic shift in mammalian cells reduction in ratio of lactate production rate to glucose consumption rate
Web References • http://www.escience.ws/b572/L24/L24.htm • http://cmgm.stanford.edu/pbrown/pdf/Brown_PO_Nat_Genet_1999.pdf • http://genome-www.stanford.edu/nci60/figures.shtml • http://jcm.asm.org/cgi/content/full/41/5/2113 • http://www.genetics.ucla.edu/microarray/ArrayManual 09-21-2001.doc • http://hugroup.cems.umn.edu/Research/Genomics/regulation.htm • http://las.perkinelmer.com/catalog/Product.aspx?ProductID=CBC0000