Download
1 / 70
740 likes | 957 Vues
Chapter 23: The Evolution of Populations. Essential Knowledge. 1.a.1 – Natural selection is a major mechanism of evolution (23.2). 1.a.2 – Natural selection acts on phenotypic variations in populations (23.1 & 23.4). 1.a.3 – Evolutionary change is also driven by random processes (23.3).

E N D
Essential Knowledge • 1.a.1 – Natural selection is a major mechanism of evolution (23.2). • 1.a.2 – Natural selection acts on phenotypic variations in populations (23.1 & 23.4). • 1.a.3 – Evolutionary change is also driven by random processes (23.3). • 2.c.1 – Changes in genotype can result in changes in phenotype (23.4). • 4.c.3 – The level of variation in a population affects population dynamics (23.1 – 23.3). • 4.c.4 – The diversity of species within an ecosystem may influence the stability of the ecosystem (23.2).
Question? • Is the unit of evolution the individual or the population? • Answer – while evolution affects individuals, it can only be tracked through time by looking at populations.
So what do we study? • We need to study populations, not individuals. • We need a method to track the changes in populations over time. • This is the area of Biology called population genetics.
Population Genetics • The study of genetic variation in populations. • How do populations change, genetically, over time? • Represents the reconciliation of Mendelism and Darwinism.
Population • A localized group of individuals of the same species. • Must produce viable offspring
Species • A group of similar organisms. • A group of populations that could interbreed (successfully) • Populations are animals of the same species that are isolated due to geography
Gene Pool • The total aggregate of genes in a population. • All alleles at all gene loci in all individuals • If evolution is occurring, then changes must occur in the gene pool of the population over time.
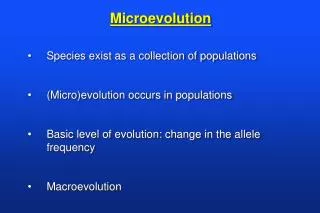
Microevolution • Changes in the relative frequencies of alleles in the gene pool. • Micro = small • Microevolution is how we study evolution at the genetics level
Hardy-Weinberg Theorem • Developed in 1908. • Use as a benchmark to study evolutionary change in a population • Mathematical model of gene pool changes over time.
H-W Theorem • States: • The frequencies of alleles and genotypes in a population’s gene pool remain constant (in a population that is NOT evolving)
Basic Equation • p + q = 1 • p = %/frequency of dominant allele • q = %/frequency of recessive allele
Expanded Equation • p + q = 1 • (p + q)2 = (1)2 • p2 + 2pq + q2 = 1 • We expand the equation to “fit” all three types of genotypes (Ex: AA, Aa, aa)
Genotypes • p2 = Homozygous Dominant frequency2pq = Heterozygous frequencyq2 = Homozygous Recessive frequency
Example Calculation • Let’s look at a population where: • A = red flowers • a = white flowers
Starting Population • N = 500 • Red = 480 (320 AA+ 160 Aa) • White = 20 • Total Genes/Alleles = 2* x 500 = 1000 *2 alleles per genotype (hence the “2” in the equation)
Dominant Allele 2 = # of times the dom allele is present in homozy dom genotype 1 = # of times the dom allele is present in heterozy genotype • A = (320 x 2) + (160 x 1) = 800 = 800/1000 = 0.8 = 80% • 320 = AA pop # (2 = # of dominant alleles in that AA genotype); • 160 = Aa pop # (1 = # of dominant alleles in Aa genotype); • 1000 = total genes
Recessive Allele 1 = # of times the rec allele is present in heterozy genotype 2 = # of times the rec allele is present in homozy rec genotype • a = (160 x 1) + (20 x 2) = 200 = 200/1000 = .20 = 20% • 20 = aa pop # (2 = # of recessive alleles in that aa/white genotype); • 160 = Aa pop # (1 = # of recessive alleles in Aa genotype); • 1000 = total genes
Importance of Hardy-Weinberg • Yardstick to measure rates of evolution. • Predicts that gene frequencies should NOT change over time as long as the H-W assumptions hold. • Way to calculate gene frequencies through time.
Example • What is the frequency of the PKU allele? • PKU is expressed only if the individual is homozygous recessive (aa).
PKU Frequency • PKU is found at the rate of 1/10,000 births. • PKU = aa = q2 q2 = .0001 q = .01 (frequency of recessive alleles)
Dominant Allele • p + q = 1 p = 1- q p = 1- .01 p = .99
Expanded Equation • p2 + 2pq + q2 = 1 (.99)2 + 2(.99x.01) + (.01)2 = 1 .9801 + .0198 + .0001 = 1 Freq of Homozy Dom genotype Freq of Heterozy genotype Freq of Homozy Rec genotype
Final Results • All we did is convert the frequencies (decimals) to % (by multiplying frequencies by 100%) • Normals (AA) = 98.01% • Carriers (Aa) = 1.98% • PKU (aa) = .01%
AP Problems Using Hardy-Weinberg • Solve for q2 (% of total) • Solve for q (equation) • Solve for p (1- q) • H-W is always on the national AP Bio exam
Hardy-Weinberg Assumptions 1. Large Population 2. Isolation 3. No Net Mutations 4. Random Mating 5. No Natural Selection
If H-W assumptions hold true: • The gene frequencies will not change over time. • Evolution will not occur. • How likely will natural populations hold to the H-W assumptions?
Microevolution • Caused by violations of the 5 H-W assumptions.
Causes of Microevolution 1. Genetic Drift 2. Gene Flow 3. Mutations 4. Nonrandom Mating 5. Natural Selection
Genetic Drift • Changes in the gene pool of a small population by chance. • Types: • 1. Bottleneck Effect • 2. Founder's Effect
Bottleneck Effect • Loss of most of the population by disasters. • Surviving population may have a different gene pool than the original population. • Results: Some alleles lost, others are over-represented, genetic variety is decreased
Importance • Reduction of population size may reduce gene pool for evolution to work with. • Ex: Cheetahs
Founder's Effect • Genetic drift in a new colony that separates from a parent population. • Ex: Old-Order Amish • Results: Genetic variety reduced, some alleles increase while other lost
Importance • Very common in islands and other groups that don't interbreed.
Gene Flow • Movement of genes in/out of a population. • Ex: • Immigration • Emigration • Result: change in gene frequency
Mutations • Inherited changes in a gene.
Result • May change gene frequencies (small population). • Source of new alleles for selection. • Often lost by genetic drift.
Nonrandom Mating • Failure to choose mates at random from the population.
Causes • Inbreeding within the same “neighborhood”. • Assortative mating (like with like).
Result • Increases the number of homozygous loci. • Does not in itself alter the overall gene frequencies in the population.
Natural Selection • Differential success in survival and reproduction. • Result - Shifts in gene frequencies.
Comment • As the environment changes, so does natural selection and gene frequencies.
Result • If the environment is "patchy", the population may have many different local populations.
Genetic Basis of Variation 1. Discrete Characters – Mendelian traits with clear phenotypes. 2. Quantitative Characters – Multigene traits with overlapping phenotypes.
Polymorphism • The existence of several contrasting forms of the species in a population. • Usually inherited as Discrete Characteristics.
Garter Snakes Gaillardia Examples
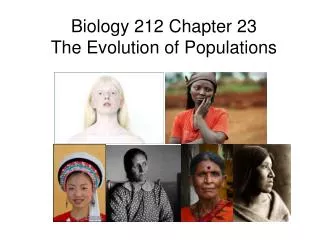
Human Example • ABO Blood Groups • Morphs = A, B, AB, O