Merging Facility and Process
Merging Facility and Process. Pedestrian Planning with Simulation Modeling Gloria Bender January 7, 2009. Outline. Introduction and Background General Modeling Approach and Considerations Simulation Modeling Examples Benefits of Simulation in Planning Conclusions. Introduction.

Merging Facility and Process
E N D
Presentation Transcript
Pedestrian Planning with Simulation Modeling Gloria BenderJanuary 7, 2009
Outline • Introduction and Background • General Modeling Approach and Considerations • Simulation Modeling Examples • Benefits of Simulation in Planning • Conclusions
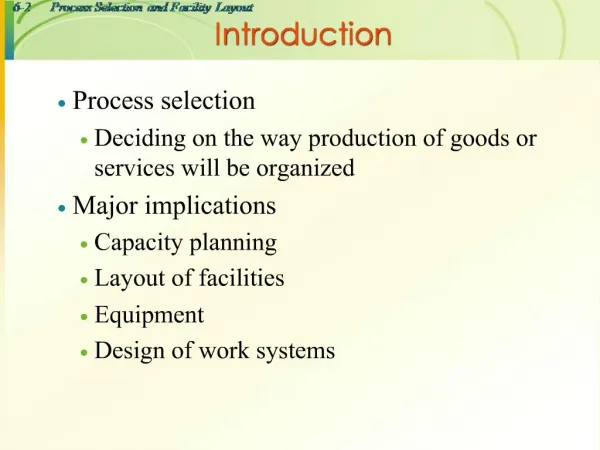
Introduction • Transportation terminals, shopping, entertainment and sport venues require special planning considerations to • Accommodate growing and highly-peaked activity schedules • Support the complex interactions of processes within the facility • Adapt to changes in market preferences • Fulfill consumers’ increasing expectations • Complexity, cost and time are causing owners to look for tools to evaluate performance of facilities prior to program selection or construction. • This presentation focuses on the use of computer simulation and animation to better plan large pedestrian service facilities.
First airside simulation project Firstlandside simulation project Management restructure 100% WBE Initiated buy/sell discussions with SABRE Our History 1986 1989 1998 2004 Management buy-out from SABRE Worked as the Airport Consulting Group within AA Decision Technologies,an AMR firm, SABRE Decision Technologies, and The SABRE Group 1997
Our Projects Worked in Over 20 Countries • Worked at 24 of the 25 largest airports • Completed over 200 simulation projects over 10 years
Typical Planning Approachs Rules of Thumb / Design Standards • Disadvantages • Do not account for system dynamics • Many projects require more sophisticated analyses • May require limiting assumptions • Limited performance measures available -- averages without statistical confidence • Many systems cannot be modeled by analytical techniques • Cannot consider dependencies • Requires mathematical sophistication • Advantages • Easy and quick to apply • Inexpensive • Historically-accepted approach
Simulation - Advantages • Once model is built, it can be used repeatedly for “what if” scenarios). • Analyze a proposed system even though the input data are somewhat sketchy • Simulation data less costly to obtain than similar data from the real system. • Analytical models usually require many simplifying assumptions to make them mathematically tractable; simulation models have no such restrictions • Any conceivable performance measure can be obtained, including detailed, custom “Level of Service” standards. • Simulation is occasionally the only means of deriving a viable solution to a problem - builds consensus
Simulation Disadvantages • May be costly, requiring more time to construct and validate than other methods • Need trained staff, software, and fast computer • Need continuous focus to complete projects • Sometimes used when analytic techniques will suffice
Calculation vs. Simulation Analysis • Simulation accounts for process distribution in assessing performance of the system. • Assumptions: • Customers arrive to a server according to uniform [.1,4.1] distribution with a 2.1 minute average • The server has a constant service time of 2.0 minutes • Simple analysis • Parameters such as arrival rates are described by averages • Using the average arrival rate (2.1 minutes), no queue will occur because the service time is less than the inter-arrival time
Calculation vs. Simulation Analysis • Simulation Analysis • Allows for parameters to be described by the actual distributions observed • Arrival rate is not uniform! • Based on five independent runs • The maximum queue before the server is 15 customers • The average queue before the server is 1.1 customers • Conclusion • When distributional information is available, using simulation analysis provides more accurate results • Sufficient detail should be included in a model to accurately portray the dynamics of the system
Caution: Simulation vs. Animation • Simulation • Mathematical representation of the system over time • Expected demand on facility • Statistical output of system performance • Multiple replications/runs must be performed to ensure confidence in results • May or may not include animation • Animation (or single-run simulation) • Graphical picture of system demand • Good idea of facility performance but • not statistically-sound results • Architectural walk-through models • Depicts ‘look and feel’ of facility • Does not include realistic demand
Why Simulate? Illustrate dynamic operations vs. static facility plan System-wide evaluation—minimizes unintended consequences Granularity of planning early-on saves design costs Captures the effects of process variability Explicitly models interactions Accounts for patron and tenant differences Provides detailed performance metrics for decision support Any metrics required—no limitations For the entire planning day as well as peak hour Enables “what if” analyses
When to Simulate? • Programming/planning phase • Concept development • Evaluate competing alternatives based on performance • Schematic design validation • Detail design • Construction phasing • Post implementation • Operational changes • Renovations/expansions • Illustrate new operations
Modeling Philosophy • Involve stakeholders (users and decision makers) throughout entire process • Owner • Applicable government regulators • Tenants • Other users • Develop unique model to answer stakeholder’s specific question • Establish the performance metrics necessary for decision support up front • Model the total system of integrated operational components • Realistic demand • Realistic environmental constraints • Interdependencies between functions
Simulation Model Considerations • Mathematical-logical representation • Physical layout—CAD drawing • Operating rules • Modeling language doesn’t matter, so long as . . . • Random Number Streams - Ensure variables of interest have separate random number streams • Simulation Replications - Place confidence intervals around your most variable output measure and ensure replications produce statistically significant differences • “Linking” models
Simulation Output Int’l Pax Connect Time • Report Results - Graphs and animation can present a wealth of data at one glance • Animation • Model delivery/GUI
Level of Service Concept • In buildings, typically expressed as space requirement • Will pedestrians be able to move freely? • Will people be comfortable? • Two aspects • Physical capacity • Varying demand • Measures • Time-based • Waiting time • Walking distance and time • Space • Square feet/person
Roadway and Curbside • Evaluate roadway design and operation • Performance metrics • Vehicles double- and triple-parked • Effective system capacity • Waiting time for shuttles, etc. • Congestion—max queues and total delay • Impact of ConRAC and consolidated bussing
George Bush Intercontinental/Houston TRACS Model Terminal D ----> Enter Terminal C Parking Garage Terminal A Terminal B Terminal C CORSIM Model • Objective • Assess roadway and curbside capacity during various construction projects • Areas Modeled • Terminal curbsides • Airport access roads to 25-mile square area • Performance Criteria • Roadway throughput • Vehicle delays
IAH Roadway (CORSIM) • System Components • Regional Freeways • Beltway 8 • US 59 • Hardy Toll Road connector • Airport Access Roadways • JFK Blvd • Will Clayton Pkwy
Airport Security Changes – Explosive Detection of Checked Bags • 100% explosive detection of checked bags • Quantify screening requirements • Quantify BHS requirements • Quantify impact of system control logic • Systems meet requirements of the Planning Guidelines and Design Standards (PGDS) for Checked Baggage Inspection Systems (October 2007)
Baggage Operations Performance • Critical performance measurements • Baggage connection time • Belt and system capacities • Queuing/congestion of tractors at bag room input belts • Staging requirement for baggage carts • Bottleneck operations in bag processing
Benefits for Facility Planning • Measure performance of proposed facility design prior to construction • Increased granularity of planning early reduces design costs • Provide performance measures that reflect the impact of various factors • Explicitly model interactions • Evaluate many alternatives quickly and inexpensively • Identify unexpected results and change the design before implementation • Evaluate new approaches without risk • Integrate facilities and systems/operations effectively • Avoids embarrassing situations - helps to “GET IT RIGHT THE FIRST TIME”
Conclusions • Simulation analysis provides benefits to decision makers: • Very detailed, quantitative comparisons of competing alternatives • Evaluation of hard-to-measure qualitative performance, such as customer “Levels of Service” • Opportunity to identify and correct design flaws prior to construction • Modeling helps owners save time and money on the planning and implementation of facility and system design projects • Pedestrian simulation models can be linked with other tools to analyze entire system to ensure balanced facilities
Merging Facility and Process Gloria Bender Managing Principal 817.359.2954 gbender@transsolutions.com Thank you.