Download
1 / 37
370 likes | 549 Vues
Eliminate the Confusion. Eliminate the Confusion!. Squeezing Bowling Ball down Garden Hose. Optimize & Reduce Workload!. Different Approach. Different Approach…. Interactive Response Time.

E N D
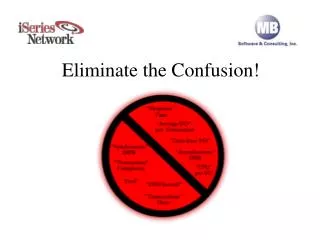
Eliminate the Confusion Eliminate the Confusion!
Squeezing Bowling Ball down Garden Hose Optimize & Reduce Workload!
Different Approach Different Approach…
Interactive Response Time 69% - Interactive response time is usually OK, but random slowdowns occur. Can’t find cause – solution appears to be a $100,000 interactive feature card.
Long Running Batch Jobs 57% - CPU used less than 50%, but batch jobs take a long time & don’t use CPU efficiently. Have been told that a bigger system with more CPU is needed.
Temporary Disk Space Jumps 48% - Disk space jumps from 70 to 90%, could be from temp space used by jobs but have not been able to prove which job is doing it.
Long Nightly Processing 44% - Night processing runs long, one CL program calls 100s of other programs and it takes 6 hrs to run.
Java & JDBC Killing System 43% - New web app uses Java & JDBC, when web lookup pages are hit, user waits 2 minutes. System was fine until new app went live.
Waiting for Pick Slips 43% - Overall CPU is only 30% used, yet users wait 6 minutes for pick slips to print. When batched, it takes 45 minutes to start printing, which delays product shipping.
Job Logs Wasting Resources 40% - 500,000 pages of job logs generated every day, logs rarely used, wasting disk space, CPU & I/O.
Job Runs 30,000 Times 38% - Our batch job runs 30,000 times per day, consumes 1 CPU second each time it runs. Ends up being 30% of CPU consumed, constantly spikes system all day.
HA Can’t Keep Up 30% - Journal receivers are 10 GB per day, HA can’t keep up.
Q&A Questions & Answers To receive MB Software’s FREE performance evaluation: 1. Register at http://www.mb-software.com2. Download and install software on AS/4003. Call (800) 713-5034 to schedule your free performance review session What To Expect: After allowing performance data to accumulate for one full business day, you will log into a secure area of MB Software’s Web site and have a conference call to discuss our findings and how you can gain performance improvements. It’s that easy!