Download
1 / 24
240 likes | 382 Vues
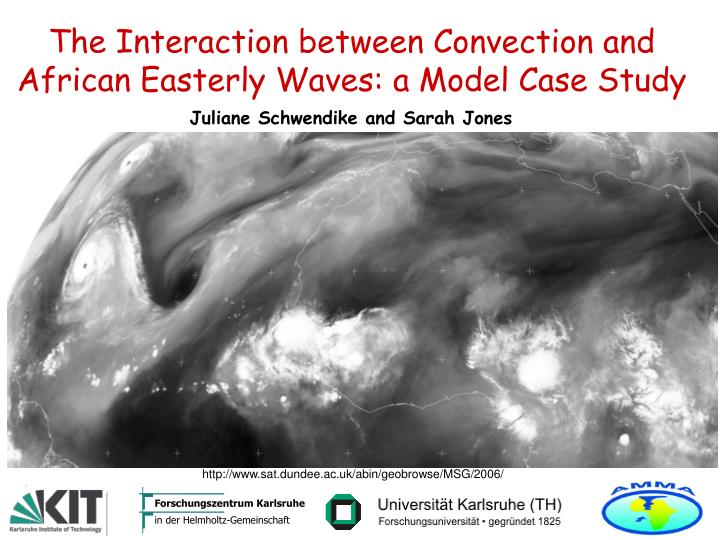
The Interaction between Convection and African Easterly Waves: a Model Case Study. Forschungszentrum Karlsruhe in der Helmholtz-Gemeinschaft. Juliane Schwendike and Sarah Jones. http://www.sat.dundee.ac.uk/abin/geobrowse/MSG/2006/. 10/09/2006, 00 UTC. 13/09/2006, 00 UTC. Tropical Depression.

E N D
The Interaction between Convection and African Easterly Waves: a Model Case Study Forschungszentrum Karlsruhe in der Helmholtz-Gemeinschaft Juliane Schwendike and Sarah Jones http://www.sat.dundee.ac.uk/abin/geobrowse/MSG/2006/
10/09/2006, 00 UTC 13/09/2006, 00 UTC Tropical Depression 10/09/2006, 12 UTC 13/09/2006, 12 UTC 11/09/2006, 00 UTC 14/09/2006, 00 UTC Tropical Storm 17/09/2006, 00 UTC 11/09/2006, 12 UTC Hurricane Helene Meteosat images: http://www.sat.dundee.ac.uk/abin/geobrowse/MSG/2006/9Channel 5: water vapour 5.35 - 7.15 µm.
Hovmoeller between 6N and 16N Relative vorticity in 700 hPa 05Sep 07Sep 09Sep 11Sep 13Sep 15Sep 40°W 20°W 0° 10°E The AEW in the 700-hPa ECMWF Analysis • Propagation speed: ~10 m s-1 • 9 Sep: Initiation of convection ahead of the trough of the AEW • 10-11Sep: crossing from Land to water • 12 Sep: tropical depression • 14 Sep: Tropical Storm Helene • 16 Sep: Hurricane Helene Tropical Depression TS Helene Convective system in satellite images Developing tropical depression in satellite images
Model simulations with COSMO 4.0 orography [m] • Forecast model of the Deutscher Wetterdienst (DWD): COSMO 4.0 • Horizontal resolution: 28 km and 2.8 km • 50 levels • No parameterisation of convectionwith 2.8km resolution • 72-h forecasts • Initiated with ECMWF analyses Model regions 100 200 400 800 1000 1200 1400 1600 1800 2000 2200 2400 2600
The AEW in the 700-hPa ECMWF Analysis and in COSMO COSMO, 28 km resolution72h Forecast initialised at 9 September 2006, 12 UTC ECMWF Analysis Hovmoeller between 6N and 16N COSMO Relative vorticity at 700 hPa Hovmoeller between 6N and 16N ECMWF Relative vorticity at 700 hPa 12UTC 12UTC 10Sep 10Sep 12UTC 12UTC 11Sep 11Sep 12UTC 12UTC 12Sep 12Sep 12UTC 12UTC 10E 0° 35W 35W 0° 10E
Convection over West Africa 12h forecast initiated at 9 Sep 2006, 12 UTC Height (1000 hPa) COSMO T+12 Vert. integral of humidity, cloud water and ice (kg/m2) + wind (m/s) 17°N 7°N 19°W 1°W 30h forecast initiated at 9 Sep 2006, 12 UTC Height (1000 hPa) COSMO T+30 Vert. integral of humidity, cloud water and ice (kg/m2) + wind (m/s) 10/09/2006, 00 UTC 16°N 12°N 8°N 18°W 12°W 6°W 10/09/2006, 18 UTC 17°N 16°N 12°N 8°N 7°N 18°W 12°W 6°W 19°W 1°W Image courtesy for the RTD Product of Météo France.
Convection over West Africa and the Atlantic 12h forecast initiated at 10 Sep 2006, 12 UTC Height (1000 hPa) COSMO T+12 Vert. integral of humidity, cloud water and ice (kg/m2) + wind (m/s) 11/09/2006, 00 UTC 12°N 8°N 24°W 18°W 12°W 21h forecast initiated at 11 Sep 2006, 00 UTC Height (1000 hPa) COSMO T+21 Vert. integral of humidity, cloud water and ice (kg/m2) + wind (m/s) 11/09/2006, 12 UTC 10°N 5°N 28°W 10°W 22°W 16°W
12h forecast initiated at 12 Sep 2006, 00 UTC Height (1000 hPa) COSMO T+12 Vert. integral of humidity, cloud water and ice (kg/m2) + wind (m/s) Becoming a Tropical Depression 12/09/2006, 12 UTC 17°N 14°N 10°N 6°N 5°N 24°W 30°W 18°W 12°W 32°W 11°W 12h forecast initiated at 13 Sep 2006, 00 UTC Height (1000 hPa) COSMO T+12 Vert. integral of humidity, cloud water and ice (kg/m2) + wind (m/s) 13/09/2006, 12 UTC 17°N 16°N 12°N 8°N 5°N 32°W 11°W 34°W 28°W 22°W 16°W
12h forecast initiated at 16 Sep 2006, 00 UTC Height (700 hPa) COSMO T+12 Specific humidity (kg/kg) and wind (m/s) Tropical Storm Helene 22°N 16/09/2006, 12 UTC 18°N 14°N 56°W 50°W 44°W Image courtesy of Jason Dunion, HRD & CIMSS. Saharan Air Layer (SAL) TS Helene 16 Sep 2006, 12 UTC Image courtesy to CIMSS.
West Africa Convection over Land vs. Ocean rel. vorticity (contours); diabatic heating (shaded) zonal wind (contours); vertical velocity (shaded) B Atlantic D
___ vertical advection - - - grid scale moist processes….. horizontal advection turbulence radiation sum of all tendencies Potential Temperature Budget Analysis: Over Land Average over box A 300 400
___ vertical advection - - - grid scale moist processes….. horizontal advection turbulence radiation sum of all tendencies Potential Temperature Budget Analysis: Over Land Average over box B
___ vertical advection - - - grid scale moist processes….. horizontal advection turbulence radiation sum of all tendencies Potential Temperature Budget Analysis: Over Land Average over box C
___ vertical advection - - - grid scale moist processes….. horizontal advection turbulence radiation sum of all tendencies Θ tendency for MCS over West Africa Ascent Descent
Potential Vorticity Budget Potential vorticity (PV): PV budget: PV budget: very small Diabatic PV changes Frictional PV changes
“Horizontal component” Diabatic PV tendency = “Vertical component” Potential Vorticity Budget PV budget:
A B C diabatic PV tendencyhorizontal componentvertical component PV tendency for the whole boxesfor MCS over West Africa
___ vertical advection - - - grid scale moist processes….. horizontal advection turbulence radiation sum of all tendencies Potential Temperature Budget Analysis: Over Water Average over box D
___ vertical advection - - - grid scale moist processes….. horizontal advection turbulence radiation sum of all tendencies Potential Temperature Budget Analysis: Over Water Average over box E
D E Θ tendency for convective system over the Ocean Θtendency for strong ascent region E D Θtendency for strong descent region
D E diabatic PV tendencyhorizontal componentvertical component PV tendency for convective system over the Ocean Diabatic PV tendency for the whole boxes
PV at the beginning PV at the end Mean PV at the beginning and end of the convective system‘s life cycle West Africa Eastern Atlantic
Summary • Updraught, heating and rel. vorticity are tilted over West Africa and upright over the Atlantic • Diabatic PV tendency at low-levels positive and negative at mid and upper levels • Increased low-level PV could enhance low-level monsoon flow behind the system and strengthen the AEW trough and AEJ at 700 hPa
Precipitable water (mm) 30h forecast initiated at 17 Sep 2006, 12 UTC Height (700 hPa) COSMO T+30 Specific humidity (kg/kg) and wind (m/s) 18 September 2006, 18UTC 28°N 20°N Image courtesy Naval Research Laboratory.www.nrlmry.navy.mil/sat_products.html Outlook: Interaction with SAL Modelling with COSMO-ART (Aerosol and Reactive Trace gases).