Population Dynamics: Density, Dispersion, and Growth Patterns
280 likes | 301 Vues
Explore concepts like density, dispersion, survivorship curves, life histories, and carrying capacity in population ecology. Learn about K-selected and r-selected populations, density-dependent factors, and more in this informative quiz.

Population Dynamics: Density, Dispersion, and Growth Patterns
E N D
Presentation Transcript
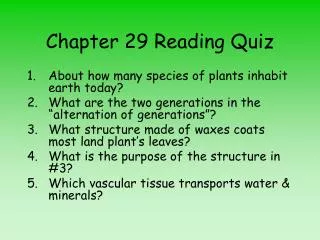
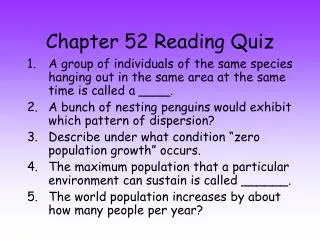
Chapter 52 Reading Quiz • A group of individuals of the same species hanging out in the same area at the same time is called a ____. • A bunch of nesting penguins would exhibit which pattern of dispersion? • Describe under what condition “zero population growth” occurs. • The maximum population that a particular environment can sustain is called ______. • The world population increases by about how many people per year?
1. What is a population? Distinguish between density and dispersion. • Population individuals of one species simultaneously occupying the same general area, utilizing the same resources, and influenced by similar environmental factors • Density the number of individuals per unit area or volume • Dispersion the pattern of spacing among individuals within the geographical boundaries of the population
2. How do scientists measure density? • May count all the individuals in a sample of representative plots; estimates become more accurate as sample plots increase in size or number • May estimate by indirect indicators such as number of nests or burrows, or by droppings or tracks • May use the mark-recapture method
3. Describe the various patterns of dispersion. • Clumped pattern “patchy” groupings of organisms • Uniform pattern spacing of individuals is even • Random pattern spacing of animals varies in an unpredictable way - very uncommon in nature
4. What is demography? Why is it important to study the age structure and sex ratio of a population? • Demography the study of the vital statistics affecting population size • Age structure relative numbers of individuals of each age in a population • Sex ratio the proportion of individuals of each sex found in a population
5. Overview the various survivorship curves, and list examples. • Type I curve flat during early and middle life and drop suddenly as death rates increase among the older individuals • Type II curve intermediate with mortality being more constant over the life span • Type III curve show very high death rates for the young followed by lower death rates after individuals have survived to a certain critical age
6. Overview how life histories are diverse yet exhibit patterns. • Life history an organism’s schedule of reproduction and death - life histories often vary in parallel with environmental factors - tropical birds lay fewer eggs than those in higher latitudes, which reflects the number of offspring that can successfully be fed (parent birds can gather more food)
7. Describe the concept of a trade-off between reproduction and survival. What does this have to do with offspring produced, number of matings, and age of maturation? • Relates to the principle of allocation • Episodes of reproduction - semelparity: invest most in growth & development, then reproduce before dying - iteroparity: fewer offspring produced over many seasons • # of offspring per episode • Maturation age balances the cost between current reproduction and survival plus future reproduction
8. Describe the conditions for the exponential model of population growth. • Describes an idealized population in an unlimited environment • Birth rates must be higher than death rates • Produces a J-shaped curve
9. Describe the concept of “carrying capacity” and logistic population growth. How does this model fit with real populations? • The “carrying capacity” of a habitat is the maximum stable population size that the particular environment can support over a relatively long time period • A “logistic population growth” model assumes the rate of population growth (r) slows as the population size reaches the carrying capacity of the environment • Some assumptions do not hold true for all populations Ex: Populations approach carrying capacity smoothly
10. Differentiate between K-selected populations and r-selected populations. • K – selected “equilibrium populations” - live at a density near the limits of their resources • r – selected “opportunistic populations” - more likely to be found in variable environments where population densities fluctuate or in open or disturbed habitats where individuals have little competition
11. Describe how density-dependent factors regulate population growth. • A density-dependent factor intensifies as the population size increases, affecting each individual more strongly • Seen in intraspecific competition, where two or more individuals of the same species rely on the same resource • Ex: disease, competition
12. Describe the effects of density-independent factors on population size. • Density-independent factors are unrelated to population size and affect the same percentage of individuals regardless of the size of the population • Ex: weather, climate, natural disasters
13. How are most populations in nature regulated? • A mix of density-dependent and density-independent factors probably limits the growth of most populations • Many populations remain fairly stable in size, close to the carrying capacity determined by the density-dependent factors • Show short-term fluctuations due to the density-independent factors
14. Describe how some populations have regular boom and bust cycles. • Lemmings have a 3 – 5 year cycle • Snowshoe hares have a 9 – 11 year cycle • Crowding may regulate cyclical population by affecting the organisms endocrine systems (stress due to high density) • May result from a time lag in response to density-dependent factors, causing the population to overshoot and undershoot the carrying capacity • Cicadas have a 13 – 17 year cycle, probably an adaptation to reduce predation
15. Overview the history of human population growth. • The human population has been growing exponentially for centuries (since 1650) but will not be able to forever • The advent of agriculture 10,000 years ago increased birth rates and decreased death rates • Better sanitation and nutrition since Industrial revolution • Scientists can not agree on what the carrying capacity of humans on earth might be…hopefully it will be a smooth leveling out once we get there