Climate change: The latest science
360 likes | 548 Vues
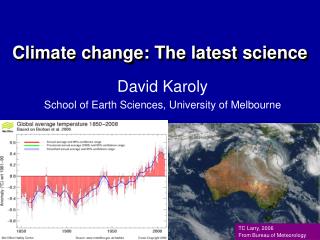
Climate change: The latest science. David Karoly School of Earth Sciences, University of Melbourne. TC Larry, 2006 From Bureau of Meteorology. Introduction. Different perspectives on climate change The latest assessment of climate change and its causes - IPCC 2007 Updates since 2007

Climate change: The latest science
E N D
Presentation Transcript
Climate change: The latest science David Karoly School of Earth Sciences, University of Melbourne TC Larry, 2006 From Bureau of Meteorology
Introduction • Different perspectives on climate change • The latest assessment of climate change and its causes - IPCC 2007 • Updates since 2007 • Climate change misinformation • International agreements and stabilising climate change
Garnaut Climate Change Review (2008) concluded • Climate change is a diabolical policy problem • Australia has a larger interest in a strong mitigation outcome than other developed countries • We are already a hot and dry country; small variations in climate are more damaging to us than to other developed countries.
Senator Fielding’s views • “The Rudd Government is yet to prove that man-made carbon dioxide emissions are the main driver behind climate change”
Intergovernmental Panel on Climate Change (IPCC) • Joint body of UN Environment Program and World Meteorological Organization, established in 1988 • Every 5-6 years, carries out a comprehensive assessment of climate change science, impacts, and approaches for mitigation and adaptation to climate change • Includes representatives from all countries • Fourth Assessment Report prepared by more than 500 scientists over the last three years • Summaries for Policy Makers approved by consensus (including representatives of the Australian govt) at meetings in Paris (Feb 07), Brussels (Apr 07) and Bangkok (May 07) • Received the 2007 Nobel Peace Prize jointly with Al Gore
‘Warming of the climate system is unequivocal, as is now evident from observations of increases in global average air and ocean temperatures, widespread melting of snow and ice, and rising global average sea level.’ (IPCC 2007) WGI Fig SPM.3
‘Global atmospheric concentrations of carbon dioxide, methane and nitrous oxide have increasedmarkedly as a result of human activities since 1750 and now far exceed pre-industrial valuesdetermined from ice cores spanning many thousands of years.The global increasesin carbon dioxide concentration are due primarily to fossil fuel use and land-use change, while those ofmethane and nitrous oxide are primarily due to agriculture.’ WGI Fig SPM.1
Causes of climate change In 2005, greenhouse gas concentration was 455 ppm CO2-eq. A large part of the warming influence is masked by aerosols. WGI Fig SPM.2
Climate modelling • Physically-based tools for studying climate variability and change • Use mathematical representations of physical laws, including Newton's second law of motion, the laws of conservation of mass and energy, laws of thermodynamics, and the ideal gas law • Represent important processes in atmosphere, ocean, land surface and ice, as well as coupling between them • More than twenty different models developed independently around the world
Annual mean precipitationObservations 1980-99Multi-model ensemble mean, 1980-99 WGI Fig 8.4
‘Most of the observed increase in global average temperatures since the mid-20th century is very likely (more than 90% certain) due to the observed increase in anthropogenic greenhouse gas concentrations.’ IPCC(2007) WGI Fig TS.23
‘Continued greenhouse gas emissions at or above current rates would cause further warming and induce many changes in the global climate system during the 21st century that would very likely be larger than those observed during the 20th century.’ WGI Fig SPM.5
‘There is now higher confidence in projected patterns of warming and other regional-scale features, including changes in circulation patterns, precipitation, and some aspects of extremes and of ice.’ • It is very likely that hot extremes, heat waves, and heavy precipitation events will continue to become more frequent. • Snow cover is projected to contract. Sea ice is projected to shrink in both the Arctic and Antarctic. • Storm tracks are projected to move poleward, with changes in wind, precipitation, and temperature patterns. • Increasing atmospheric CO2 concentrations lead to increasing acidification of the ocean. • 21st century anthropogenic CO2 emissions will contribute to warming and sea level rise for more than a millennium, due to the long timescales required for removal of this gas.
Projected climate change hotspots in Australia (from IPCC AR4 WGII, chapt 11)
Observations to 2005 From Stroeve et al, GRL, 2007
Sea ice in Sept 2007 From Stroeve et al, GRL, 2007 Sept 2005
Observed and projected Australian rainfall Best estimate projected rainfall change for 2070(from “Climate change in Australia”) Observed trend in annual rainfall 1960-2008
2006 2005 Global CO2 emissions from fuel consumption Comparison of IPCC emission scenarios and new growth path SRES (2000) growth rates in % y -1 for 2000-2010: A1B: 2.42 A1FI: 2.71 A1T: 1.63 A2: 2.13 B1: 1.79 B2: 1.61 Observed 2000-2006 3.3%/yr From Raupach et al. 2007, PNAS
Causes of climate change Myth: The observed warming has been due to variations in solar forcing 1. Increases in solar irradiance would cause warming in the upper atmosphere and lower atmosphere, but cooling in the upper atmosphere has been observed From the Hadley Centre (UK) www.hadobs.org
Causes of climate change Myth: The observed warming has been due to variations in solar forcing 2. Increases in solar irradiance would cause more warming in summer than winter, and in daytime than nighttime, but the opposite is observed IPCC AR4 WGI Fig 3.2
Causes of climate change Myth: The observed warming has been due to variations in solar forcing associated with the solar sunspot cycle Wrong! 1) Satellite observations show significant changes in solar irradiance due to the 11-year sunspot cycle, but no long term trend. However, global temperatures show a warming trend but no 11-year cycle. IPCC WGI Fig 2.16
Causes of climate change Myth: Changes in cosmic rays have caused changes in cloudiness, leading to global warming No!Large 11-year cycle in cosmic ray activity, but no recent trend No clear link between cosmic rays and clouds, as there are plenty of CCN (cloud condensation nuclei) in many regions
Climate variations over the last millenium Myth: The medieval warm period was warmer than present Wrong! Multiple climate reconstructions show “the warmth of the last half century is unusual in at least the previous 1300 years.” Reconstructions of NH average temperature WGI Fig TS.20
Recent observed global mean temperature Myth: Global average temperature has cooled since 1998 Wrong! No significant warming or cooling, due to short period. 1998 the hottest year globally, due to El Niño event, and recent cooling due to La Niña in 2007 and 2008. Rapid recent warming. Long term warming, with the 2000’s the warmest decade
UN Framework Convention on Climate Change (UNFCCC) • Established following the United Nations conference on Environment and Development in Rio de Janeiro in 1992 • Objective is “stabilization of greenhouse gas concentrations in the atmosphere at a level that would prevent dangerous anthropogenic interference with the climate system” • “Such a level should be achieved within a time frame sufficient to allow ecosystems to adapt naturally to climate change, to ensure that food production is not threatened, and to enable economic development to proceed in a sustainable manner” • Ratified by 192 countries, including USA and Australia, and came into force in March 1994
Who has caused the problem? UNFCCC includes principle that: “Parties should protect the climate system...on the basis of equity and in accordance with their common but differentiated responsibilities and respective capabilities. Accordingly, the developed country Parties should take the lead in combating climate change” (UNFCCC, Art.3.1). Regional greenhouse gas emissions in 2004 SyR Fig 2.2a
Stabilisation scenarios • 455 ppm CO2-eq in 2005, 379 ppm CO2 conc • I: CO2-eq stabilisation at 445-490 ppm, emissions peak in 2000-2015, global CO2 emissions -85% to -50% in 2050, warming of 2.0 to 2.4C above pre-industrial • Assuming equal per capita emissions, 50% global emission reduction in 2050 means ~90% emission reduction for Australia IPCC SyR Fig SPM.11
Probability distribution of committed global warming (relative to preindustrial) for greenhouse gases in the atmosphere in 2005 From Ramanathan and Feng, PNAS, 2008
Key messages, Climate Change: Global Risks, Challenges & Decisions, Copenhagen in March 2009 • Recent observations confirm that, given high rates of observed emissions, the worst-case IPCC scenario trajectories (or even worse) are being realized • Recent observations show that societies are highly vulnerable to even modest levels of climate change, with poor nations and communities particularly at risk. • Rapid, sustained, and effective mitigation based on coordinated global and regional action is required to avoid "dangerous climate change" regardless of how it is defined. • Delay in initiating effective mitigation actions increases significantly the long-term social and economic costs of both adaptation and mitigation
References • IPCC web site http://www.ipcc.ch/ • US GCRP “Climate literacy: The essential principles of climate sciences”http://www.globalchange.gov/resources/educators/climate-literacy • Climate change in Australia site http://www.climatechangeinaustralia.gov.au/ • Climate Works Australia FAQ on climate science http://www.climateworksaustralia.com/Q_and_A.pdf My contact information: Prof David Karoly, School of Earth Sciences, dkaroly@unimelb.edu.au