Download
1 / 2
20 likes | 293 Vues
Solid State Spectroscopy With LED Sources Anant K. Ramdas, Purdue University, DMR 0705793.

E N D
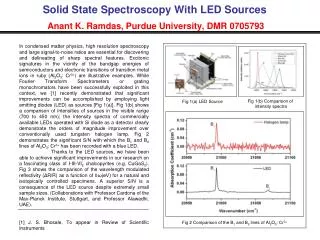
Solid State Spectroscopy With LED SourcesAnant K. Ramdas, Purdue University, DMR 0705793 In condensed matter physics, high resolution spectroscopy and large signal-to-noise ratios are essential for discovering and delineating of sharp spectral features. Excitonic signatures in the vicinity of the bandgap energies of semiconductors and electronic transitions of transition metal ions in ruby (Al2O3: Cr3+) are illustrative examples. While Fourier Transform Spectrometers or grating monochromators have been successfully exploited in this context, we [1] recently demonstrated that significant improvements can be accomplished by employing light emitting diodes (LED) as sources [Fig 1(a)]. Fig 1(b) shows a comparison of intensities of sources in the visible range (700 to 450 nm); the intensity spectra of commercially available LEDs operated with Si diode as a detector clearly demonstrate the orders of magnitude improvement over conventionally used tungsten halogen lamp. Fig 2 demonstrates the significant S/N with which the B1 and B2 lines of Al2O3: Cr3+ has been recorded with a blue LED. Thanks to the LED sources, we have been able to achieve significant improvements in our research on a fascinating class of I-III-VI2 chalcopyrites (e.g. CuGaS2). Fig 3 shows the comparison of the wavelength modulated reflectivity (ΔR/R) as a function of ℏω(eV) for a natural and isotopically controlled specimens. A superior S/N is a consequence of the LED source despite extremely small sample sizes. (Collaborations with Professor Cardona of the Max-Planck Institute, Stuttgart, and Professor Alawadhi, UAE). [1] J. S. Bhosale, To appear in Review of Scientific Instruments Fig 1(b) Comparison of intensity spectra Fig 1(a) LED Source Fig 2 Comparison of the B1 and B2 lines of Al2O3: Cr3+
Solid State Spectroscopy With LED SourcesAnant K. Ramdas, Purdue University, DMR 0705793 Future Plans: Apply high resolution and low noise spectroscopy to isotopically controlled AgGaS2, ZnGeAs2 and their spintronic alloys. Education/Broader Impact: The research reported here is the outcome of a close colaboration between the two PIs [Ramdas (Experimental) and Rodriguez (Theorist)]; Jayprakash Bhosale (Graduate Student), Dr. Miotkowski (Research Scientist in Charge of Crystal Growth), Professors M. Cardona (MPI, Stuttgart), H. Alawadhi (UAE), and S Venugopalan (SUNY, Binghamton). These are examples of the interactive and stimulating ambiance in which our graduate students carry out their research; this experience prepares them for an exciting future in universities as well as national and industrial laboratories. Fig 3 Modulation spectrum of isotopically controlled CuGaS2