Download
1 / 105
1.05k likes | 1.27k Vues
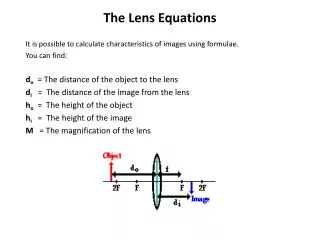
Diagram 2.1. Diagram 2.2. The thickness of lens in diagram 2.1 is compare to lens diagram 2.2. thicker. The focal length in diagram 2.1 is compare to diagram 2.2. shorter. smaller. The size of image produced in diagram 2.1 is compare to diagram 2.2.

E N D
Diagram 2.1 Diagram 2.2 The thickness of lens in diagram 2.1 is compare to lens diagram 2.2 thicker The focal length in diagram 2.1 is compare to diagram 2.2 shorter smaller The size of image produced in diagram 2.1 is compare to diagram 2.2.
Thickness of the spring wire • Maximum height reached by the ball • Relate : • Thickness and maximum height • Thickness and elastic potential energy
Compare depth of sinking : Depth of sinking on diagram 3.1 is deeper than diagram 3.2 Compare load : The load of diagram 3.1 is equal to diagram 3.2 Area on contact : The area of contact in diagram 3.1 is smaller than Diagram 3.2 Relate depth of sinking and pressure The deeper the depth, the higher the pressure Relationship Pressure and area When the area increaes,the pressure decreases
Explaination question 3 or 4 marks
Submarine on surface submerge ( 3 marks) Ballast tank Partly filled Weight = buoyant force Fill with water Weight increases Weight > buoyant force Submarine submerge
Thermal equilibrium • Heat flow • Hot to cold • Thermal equilibrium achieved. • Temperature of water = temp of thermometer • No more heat flow
High pitch , only C , low pitch until A High pitch high frekuensi Short wave length will diffract until C only Low pitch low frekuensi long wave length
Sweat cold rotating fan Sweat is being evaporated
Diagram below shows a sailboat. You are required to give some suggestions to design a sailboat which can travel faster. Using the knowledge on motion, forces and the properties of materials, explain the suggestions based on the following aspects: • the surface of the board • the shape of the board • material used for the sail • the size of the sail smooth surface / coat with wax streamlineshape lowdensitymaterial Wide size water-proof material
Type of material used as the cap of the thermal flask • Type of inner wall and outer surface • The density of material used • Thermal strength of the flask
Use flourescent lamp • Reduce the heat from the desk lamp Bigger cover with white colour • Design of the lamp desk • Safety features of the lamp Connect earth wire Energy efficiency of the lamp Energy saver lamp • Comfort of the person who will use the lamp. Adjustable stand
Capacity • Safety features • Power • Stability and other relevant aspects
variables • Manipulated : depth of water ( real depth) • Responding : position of image (apparent depth) • Constant : density of water
Inference : Depth of water affect the position of image. Hypothesis : when real depth increases, the apparent depth increases.
Aim : To investigate the relationship between depth of water ( real depth ) and position of image ( apparent depth)
Apparatus and material : tall beaker, meter rule, pins, cork, water, retort stand
procedure • Mention manipulated quantity : Real Depth : start experiment with what depth?? Fill the beaker with water to a height of 20 cm
b) Method of measuring responding variable : apparent depth With meter rule, measure the apparent depth. Repeat experiment : Repeat experiment with different depth such as : 30 cm, 40 cm, 50 cm and 60 cm.
Analyse data Apparent depth / d ( cm ) Real depth / D (cm)
variable mass • Manipulated : Responding : Period oscillation Constant : Number of oscillation
inference • ____________________ affect _______________________ mass Period oscillation
hypothesis mass When increases, increases period of oscillation
aim To investigate the relationship between and mass period of oscillation
Apparatus and arrangement • Hacksaw blade, stop watch, plasticine and G clamp.
Method of controlling manipulated variable • Manipulate variable : mass control : the first mass Plasticine with a mass of 50 g is clamped.
Method of measuring responding variable • Responding variable : period • Measure pressure using : stopwatch Using stop watch , measure the time taken for 20 complete oscillation, calculate the period and record the data
Analyse data Period / s Mass / g 20 30 40 50 60
Graph Mass / g Period / s
variable force • Manipulated : Responding : Extension of the spring Constant : Diameter of the spring
inference • ____________________ affect _______________________ force extension of the spring
hypothesis force When increases, increases extension of the spring
aim To investigate the relationship between and force extension of the spring
Apparatus and arrangement • Spring, slotted weight, retort stand, meter rule
Method of controlling manipulated variable • Manipulate variable : force control : the first mass of slotted weight • Slotted weight of 50 g is attached to the spring.
Method of measuring responding variable • Responding variable : extension of the spring • Measure pressure using : meter rule Using meter rule, measure the length of the spring .
Analyse data 20 30 40 50 60
Graph Force / N Extension of the spring / cm