Download
1 / 43
450 likes | 655 Vues
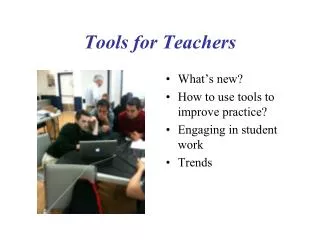
Tools for Teachers. What’s new? How to use tools to improve practice? Engaging in student work Trends. Tying Tasks to CCSS. Mathematical Practices. Perseverance Reason abstractly and Quantitatively Construct viable arguments and critique the reasoning of others. Model with mathematics.

E N D
Tools for Teachers • What’s new? • How to use tools to improve practice? • Engaging in student work • Trends
Mathematical Practices • Perseverance • Reason abstractly and Quantitatively • Construct viable arguments and critique the reasoning of others. • Model with mathematics. • Use tools strategically. • Attend to precision. • Look for and make use of structure. • Look for and express regularity in repeated reasoning.
Students develop their ability to construct viable arguments and to critique the reasoning of others. • What makes a good justification? • What is involved in making it complete? • What types of quantification can be used to support claims or conjectures? • What sentence structures help students develop a logical sequence to ideas?
What qualities would you like to see in a good justification? • Work individually and then with a partner to list what should go into a justification. • Then look at student work. • Which explanation did you like the best? Why? • What were the qualities or arguments that made it a good justification?
What qualities would you like to see in a good justification? A powerful technique from the Formative Assessment Lessons is to use student work and see how it could be improved. • Then look at student work again. • How could each statement be improved? • What qualities or arguments are missing that prevent it from being a good justification?
Looking at the Data • 37% of the students omitted a vertical scale • Making the scale was one of the two ramps of the tasks.
Implications for Instruction In planning learning trajectories or units around a big idea, like understanding scale, there aren’t short cuts. The type of thinking required to add data to a graph has a higher cognitive demand than just reading information from a graph. The ability to think between squares and what the squares represent is challenging. Further, the cognitive demands for planning a scale and putting equal-size units on a graph is different from using a graph with a scale already provided. Planning what size units will allow all the data to be represented is one part. Understanding that the scale is different from just a listing of the different data points is another. Classroom activities and discussions need to help students build these layers of understanding.
Ideas for Action Research How much did Sulian save in July?
Ideas for Action Research How much did Sulian save in July?
How would you continue the lesson? • Looking at your own student work or work from the toolkit, think about how to continue this lesson. How can you use the student work to pose a question? • Besides graphing, what are some other important issues that you want to address? Again find some pieces of student work from the toolkit or from you student work. How can you use it to pose questions for the class? How does answering the question confront misconceptions? How does it deepen the mathematics of the lesson?
Toolkits • Help guide teachers in how to plan a re-engagement lesson • Resource for interesting student work which will highlight big mathematical ideas and concepts
Understanding Mathematical Modeling and Deepening Understanding of Operations in context • Work the task: Sub Sandwiches (pg. 1 only) • What does a student need to understand about fractions and rates to make sense of this task? • What does a student need to understand about multiplication and division? • What is important in a model?
Re-engagement Lesson Set the hook for the lesson: • What do you know about multiplication? • Where are the equal groups? • How many equal groups? Spend time on having students explain and verbalize beginning of task, to build foundation for rest of lesson.
How many tomatoes does she need? “I saw a student make this diagram. Can you help me figure out what the student is doing? How do you think the student answered the question?
“What do you think the student is doing? Does this make sense? “How is this the same as the drawing? How is it different?”
“What is the student thinking? Does it make sense? Why or why not?
How many sandwiches can Laura make with 5 tomatoes? “Someone said there would be 5 sandwiches. I drew buns with salami and 1 half tomato until there 5 tomatoes in all.
What is this student doing? Does it make sense? What qualities make it easier to use?
“Does this make sense? How it it like the diagrams? What are the equal groups?”
Can this work? We just saw how multiplication Helped to answer the question. So does this Make sense? Why or why not?
Re-engagement Lessons • Help to build from concrete to abstract • Help to bridge the meaning of operations and connections between multiplication and division • Show students strategies or new tools to use • Help students understand how models can be used and improved
What does it mean to know? • Tool Possession: Is the tool in the toolbox? • Too Understanding:Is the operation of the tool understood? • Tool Application: Can the tool be used in a real-world context? • Tool Selection: When given a big problem, what tools does the student use?
Teaching for Transference • What does a student need to understand about variables and how they are used? • What do students understand about setting up equations? What clues do the equations give them about solving the problem? • What strategies do students have for solving systems of equations algebraically?
Declining Grades • Geometry - Dropping from 78% in 2009 to 50% in 2011, a 2 year decline • 8th Grade - dropped -.39 std units to 19.9% meeting standards • 7th Grade -dropped - .67 std units to 23.7% from 54% in 2010
Improving Grades • 3rd Grade - 70.7% meeting standards • 4th Grade - 71.5% meeting standards • 5th Grade - 76.5% meeting standards • 6th Grade - 43.2% meeting standards up from 34.5% in 2010
About the Same • 2nd Grade - 78.9% meeting standards • Algebra - 46% meeting standards up from 39% in 2009
Looking at Middle Grades • 6th Grade - 43.2% • 7th Grade - 23.7% • 8th Grade- 19.9% • Algebra - 43.2% • Geometry - 50%
Second Grade • Students had the most difficulty with Striped Fish. They had trouble with visual discrimination and drawing the stripes on the fish. This causes problems at later grade levels.
Visual Discrimination - 3rd 26% thought the pentagon looked like a house or an ice cream cone.
Visual Discrimination - 3rd Students have trouble with the idea of area because they aren’t seeing space in terms of rows and columns.
Visual Discrimination - 6th Grade Students had difficulty maintaining shape and scale. Only 24% of students met standard on this task.
Visual Discrimination - 7th Grade Students can’t interpret the diagram to think how to fold the shape or how dimensions fit together.
3rd & 4th Grade Road Signs and Spot the Difference • Students don’t know how to compare and contrast shapes. • They struggle with geometric vocabulary. • They only know a few attributes. • They consider names and shapes to be attributes.
6th Grade • Memory Game - Probability • 32% scored no points • Only 42% met standards • Animal Pattern - Geometry • 30% scored no points • Only 24% met standards • 100 People -Proportional Reasoning • 20% scored no points • Only 27% met standards
7th Grade • Wallpaper - Geometry and Measurement • 43.5% zero/ 16.8% met standard • Million Dollars - proportional reasoning • 21% zero/ 43% met standard • Boxes - Geometry and Measurement • 34% zero/ 18% met standard • Population - Reading Graphs/Percents • 16.5% zero/ 23% met standard
8th Grade • Jane’s t.v. - Geometry/ Pythagorean theorem & working with exponents • 53% no points • 27% met standard • Matchsticks - Geometry/ Measurement Volume • 53% no points • 14.8% met standard
Algebra- Understanding Graphs Only 26.5% met standard.