Download
1 / 7
80 likes | 216 Vues
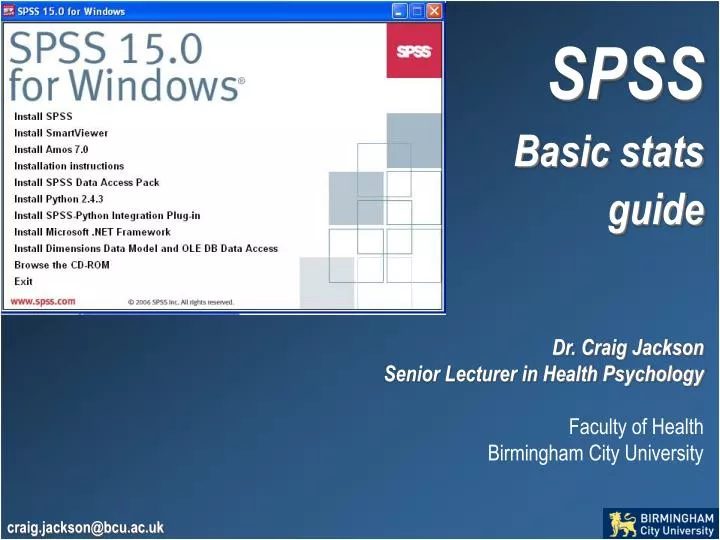
SPSS Basic stats guide Dr. Craig Jackson Senior Lecturer in Health Psychology Faculty of Health Birmingham City University. craig.jackson@bcu.ac.uk. Types of Data / Variables Continuous Discrete BP Children Height No. colds in last 12 months Weight Age last birthday

E N D
SPSS Basic stats guide Dr. Craig Jackson Senior Lecturer in Health Psychology Faculty of Health Birmingham City University craig.jackson@bcu.ac.uk
Types of Data / Variables ContinuousDiscrete BP Children Height No. colds in last 12 months Weight Age last birthday Age BMI OrdinalNominal Grade of “condition” Sex Positions in race 1st 2nd 3rd Hair colour “Better - Same – Worse” Blood group Height groups Eye colour Age groups Ethnicity
Types of statistics / analyses DESCRIPTIVE STATISTICS Describing a phenomena Frequencies How many… Basic measurements Meters, seconds, cm3, IQ INFERENTIAL STATISTICS Inferences about phenomena Hypothesis Testing Proving or disproving theories Confidence Intervals If sample relates to the larger population Correlation Associations between phenomena Significance testing e.g diet and health
26 25 24 23 22 21 20 Multiple Measurement 25 cells 22 cells 24 cells 21 cells Total = 92 cells Mean = 23 cells SD = 1.8 cells
Small samples spoil research N Age IQ 1 20 100 2 20 100 3 20 100 4 20 100 5 20 100 6 20 100 7 20 100 8 20 100 9 20 100 10 20 100 Total 200 1000 Mean 20 100 SD 0 0 N Age IQ 1 18 100 2 20 110 3 22 119 4 24 101 5 26 105 6 21 113 7 19 120 8 25 119 9 20 114 10 21 101 Total 216 1102 Mean 21.6 110.2 SD ± 4.2 ± 19.2 N Age IQ 1 18 100 2 20 110 3 22 119 4 24 101 5 26 105 6 21 113 7 19 120 8 25 119 9 20 114 10 45 156 Total 240 1157 Mean 24 115.7 SD ± 8.5 ± 30.2
Dispersion Range Spread of data Mean Arithmetic average Median Location Mode Frequency SD Spread of data about the mean Range 50-112 mmHg Mean 82mmHg Median 82mmHg Mode 82mmHg SD ± 10mmHg
Central Tendency and Averages Mode Median Mean Patient comfort rating 10 9 8 7 6 5 4 3 2 1 31 27 70 121 140 129 128 90 80 62 Frequency