Download
1 / 43
430 likes | 463 Vues
Explore the economic contribution of tourism to South Africa's economy, including employment, GDP, and non-VAT registered businesses. Learn about tourism statistics, travelers' patterns, and the Tourism Satellite Account (TSA).

E N D
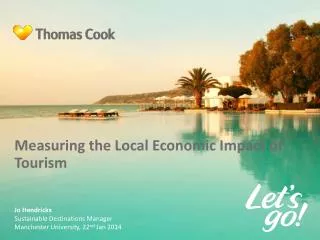
Measuring the economic contribution of Tourism to the economy of South Africa Pali Lehohla Statistician-General Tourism Summit: Parliament 28 February 2010
Content • Outline of Presentation • What is tourism • Sources of information for tourism • Patterns of domestic tourism • Contribution of Tourism to Employment and GDP • Status of non-vat registered businesses
Content • Tourism and the TSA • TSA results • Tourism Statistics at Statistics South Africa
Travellers Visitors Same day visitor Some might be in transit Don’t spend a night Tourist Some might be in transit Do spend a night (see next slide) WORKERS paid in the country visited DIPLOMATS MIGRANTS REFUGEES Others within USUAL ENVIRONMENT Tourism: their activity Tourism: their activity Intro to tourism Other travellers
Tourism is Difficult to Measure What is a TSA 85% Hotels Tourist 45% Not a Tourist! Restaurants
Tourism Tourism includes all trips away from one’s usual environment, not just holiday/leisure trips. It also includes business, visiting friends and/or relatives, medical/health trips, and religious journeys amongst others. Trip A journey taken outside of the usual environment of the household. Usual environment The usual environment is defined as all places within a 40 kilometer radius of the place of usual residence of the respondent, AND all places that the respondent visits at least once a week (e.g., going to work), irrespective of the distance from their place of usual residence. Day trip A trip outside of the respondent’s usual environment, where they leave and return within the same day. Overnight trip A trip outside of the respondent’s usual environment where one night or more is spent away from the household. Concepts and definitions
What does the TSA do? TSA • It is a statistical instrument used to measure the size of the tourismindustry’s contribution to the economy of a country according to international standards of concepts, classifications and definitions; • Allow for valid comparisons with other industries and eventually from country to country and between groups of countries; • Fundamental structure of a TSA is based on the general relationship existing within an economy between the demand of goods and services generated by tourism on the one hand and their supply on the other hand – it therefore brings together the demand- and supply side of the tourism industry;
Why a TSA? TSA • A TSA provides a framework for policy analysis of issues related to tourism economics, as well as for model-building, tourism growth analysis and productivity measurements; • A TSA is constructed using official data and not modeling techniques; • The main purposes of the TSAs are to: • analyse in detail all the aspects of demand for goods and services which might be associated with tourism within the economy; • observe the operational interface with the supply of such goods and services within the same economy of reference; and • describe how this supply interacts with other economic activities.
TSA Tables The 10 tables of the TSA
Tourism and Migration Travellers versus Tourists (2009) (Tourism 2009, Report 03-51-02 (2009)) Foreign travellers 18 778 556 Arrivals 10 098 306 Departures 8 680 250 Visitors 9 531 615 Non Visitors 566 691 Same day visitors 2 519 750 Tourists 7 011 865
Province of destination Gauteng was the most visited province on day trips (24,2%) KwaZulu-Natal had the highest proportion of overnight trips (22,7%).
Province of destination Percentage of day and overnight trips by province of destination
Purpose of visit The main reasons for taking trips was visiting friends and family/relatives and leisure: Day trips - VFR: 29,7% and Leisure: 20,6% Overnight trips – VFR: 54,0% and Leisure: 25,0%
Mode of of transport Totals include other modes of transport e.g. aircraft, trains, motorcycles and bicycles
When trips made to Western Cape people used cars (76,3%), taxi (7,5%), aircraft (6,8%) and bus (6,8%). Travellers to Gauteng used taxis (43,4%), cars (30,8%), buses (15,7%) and trains (7,7%). Fifty five (55,1%) used taxis, cars (30,8%) and buses (12,5%) to reach the Limpopo province. The mode of transport of most of the travellers to Kwazulu-Natal was taxi (48,7%), cars (38,1%) and buses (10,1%). Forty per cent (40,1%) of trips to Eastern Cape were made by taxis, 33,5% by cars and 19,4% by buses. Destination by mode of transport
The age group 30 – 34 most likely to travel. 1,018 million overnight trips 606 000 day trips Age distributions by day and overnight
TSA role players Roles and responsibilities of key role-players Working team Construct the TSA Collect and provide data SARS Stats SA SAT SARB DHA dti NDT Other industry players Users
Contribution of tourism to employment and size of the economy
Key concepts Key concepts used in the TSA
Key Results: Employment Tourism employment,2005 to 2008
Domestic Outbound Inbound Concepts &Definitions Forms of Tourism National Internal International
TSA results Internal tourism consumption expenditure by types of products, 2005 to 2008
TSA results Comparison – Tourism vs traditional industries (Value Added)
TSA results Comparison – Tourism vs traditional industries(Employment)
Background to non registered businesses • Businesses which are not registered are generally excluded from the Business Frame which is used by Stats SA in the business surveys to assess the formal economy. • However, non-registered businesses also contribute to the economy of the country • It is for this reason that Stats SA introduces a survey of employers and the self employed (SESE) in 2001 • SESE is a household based survey that measures the contribution of non registered businesses to the economy. • The survey also provides information on the characteristics of individuals operating these businesses • This survey is done once every 4 years
Number of persons running at least one business by industry Most of the non-VAT registered businesses were operating within the Trade industry -1,6 m in 2001 and 1.1 m in 2009 (Although the number had declined by 614 000 in 2009, Trade was still the highest contributor)
The main reason for starting a business Unemployment or not having alternative income source (more than 60% in all the three time periods under review) was indicated as the main reason why people decided to start a business
Proportion of those who did not need money to start a business by industry • The highest proportion of business owners who did not need money to start their businesses were in • Trade.
Proportion of those who needed money to start a business by source of money • Among those who needed money over 70% used their own money to start their own businesses
Proportion of those who borrowed money to start a business by source of money • The majority of persons who borrowed money to start a business, borrowed it from friends or relatives. • The proportion of persons who borrowed from commercial banks increased from 4,0% in 2001 to 8,4% in • 2009