Download
1 / 47
490 likes | 561 Vues
Delve into the world of Advanced Metering Infrastructure (AMI) for water utilities, covering selection, acquisition, and implementation strategies. Learn how AMI works, enhances system operations, improves hydraulic models, and fosters operational efficiency. Gain insights into AMR/AMI terminology, ancillary devices, intelligent meters, interval reads, and AMI network architecture. Discover how AMI supports large meter management, water system operations improvement, leak detection, and non-revenue water tracking. Explore the applications of AMI for acoustic monitoring and continuous leak detection. Benefit from best practices and cutting-edge technology in optimizing water utility operations.

E N D
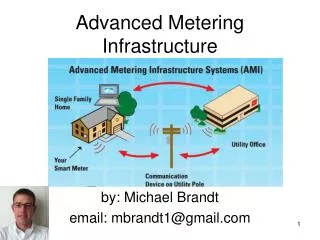
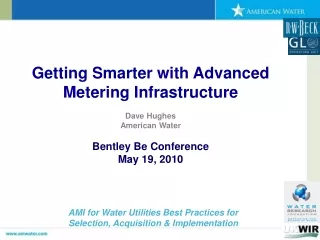
Getting Smarter with Advanced Metering Infrastructure Dave Hughes American Water Bentley Be Conference May 19, 2010 AMI for Water Utilities Best Practices for Selection, Acquisition & Implementation
Utility Only O&M Only Both American Water • Largest investor-owned water services provider in North America • Serves 16.2 million people • Operations in 32 states and Canada • 7,000 employees • 308 individual service areas • 71,500 km (45,000 miles) of distribution mains
Presentation Outline • AMI Terminology and How AMI Works • AMI and Improving Water System Operations • AMI and Improving Hydraulic Models • AMI Fostering a Fit Between Operations & Models
AMR/AMI Terminology AMR - automated process that collects readings from customers’ meters without directly accessing the meter and can export reads to a remote central location AMI (Advanced Metering Infrastructure) automated process that collects readings and other data, typically without going to the meter site, often two way communication to facilitate data transfer Ancillary devices Actuators - using the AMI communication network to operate equipment (e.g., customer shut-off valves) Sensors – using AMI communication to process information from monitors other than meters (e.g., leak detectors) Intelligent meters – Reading devices with internal data storage/analysis capabilities to provide information/alerts to supersede or supplement readings Interval Reads - providing multiple period water usage data at predetermined or remotely configurable time intervals with individual collection transmissions
Advanced Metering Infrastructure Backhaul (“WAN”) First Hop (“LAN”) Receiver DataColl.Unit ComLink 1 ComLink 2 MIU Repeater ApplicationSoftware Transponder Hardware Transponder CIS Encoder Intelligent CPU, Memory Host Controller Other Sensor Encoder OtherSystems Actuator Meter Meter DataManagementSystem(Database)
Mesh Network Architecture and Speed DCU DCU DCU DCU “Modified” or “partial” Mesh Network MIU MIU MIU Collector/ Gateway MIU MIU MIU “Full” Mesh Network MIU MIU MIU MIU MIU MIU MIU MIU MIU MIU MIU
Improving Water System Operations • Meter selection and accuracy • Non Revenue Water Evaluation (DMA) • System Leak Monitoring • System Backflow • Water Quality Monitoring
Fixed Network Radio AMI Requirements Two way communication with MIU Synchronized time Programmable MIU units Battery Power! Smart Mesh Photos courtesySensus Photo courtesyItron Photo courtesyAclara
Meter Age/Registration Change How long should meters be left in service? Most meters last a long time, only a few fail Function of: meter cost, installation cost, cost of water (& WW), volume passed, inflation rates, discount rate, rate of accuracy decline
Large Meter Replacement Doubled Total Registration Data courtesy San Diego Water Department
AMI Can Support Large Meter Management • Right-sizing analysis • Right-typing analysis • Flow profile (depends on time interval)
District Metering • Areas of the system receive water supply from limited, metered mains. When metered use (overnight flow) is unusually high, that DMA is targeted for a leak survey. • Districts allow leak survey teams to focus on problem areas. • District metering promotes step testing to find leaks. • District metering quantifies leak for water audit analysis.
AMI Can Help Track and Identify Non-Revenue Water Variable NRW level suggests source is meter error or theft Controllable NRW constant level suggests source is leakage Supply to system NRW Supply to system NRW Metered Usage Metered Usage
Sensors Expand AMI Applicability • Distribution system leak detection • Conservation • Backflow detection • Automatic shutoff • Pressure sensors
Using AMI for Continuous Acoustic Monitoring (CAM) • Acoustic monitoring interfaces to AMI systems to provide routine leak detection • FCS Permalog attaches to valve nut in street, transmits separately from meters • Gutermann Zone Scan units attach to valve nut, transmitter housed in valve box. Developing remote correlation capability. • Itron MLOG units attach to service line • Find small leaks sooner, when they are easier to repair and can be scheduled • Reduce crews or improve service level
MLOG Acoustic Monitor • Installed near a water meter. • Easily strapped to service pipe or meter • Maintenance-free, now able to survive meter pit environment. • Battery Life – Radio MLOG 8 years and Fixed Network 15 years. • Fixed Network AMR sends data to host on website daily. Mobile Units, a separate controller unit acquires up to 11 days of history.
Permalog Acoustic Monitor • Installed on operating nut of water valves. Magnetic bottom secures unit • Newer model more robust for valve box environment • Battery Life 5–10 years • Unit sends leak or no leak condition through to network, Datamatic will send data • For Mobile Units, a separate controller unit acquires data
StarZoneScan Acoustic Monitor • Installed on operating nut of water valves. Magnetic bottom secures unit • Connects directly to AMR Transmitter in valve box • Battery Life – 10 years • Fixed Network AMR sends condition through network • Zone Scans to be used to correlate leaks.
Fixed Network & CAM Data Collector Units CAM SOFTWARE Acoustic (leak) Data Meter Reads, Meter Status Billing Meter reads Acoustic (leak) Data Meter Transmitter Units Billing, and recent Meter reads Selected Reports Selected Meter reads MLOG Water Meter Water Meter Water Meter American Water Computer Schematic courtesy of Hexagram
The Meter/AMR/AMI/Acoustic Monitoring Relationship Maze MetersNetwork AMI Acoustic Monitors Aclara Neptune Gutermann Neptune Itron MLOG Itron Badger Mueller Systems Itron 2nd generation Actaris Metron Farnier Metrotech Datamatic Elster Permalog Badger Sensus Elster Echologics Sensus Mueller Systems KP Electronics
Using Acoustic Monitors • Deploy units about every block. Leaks are detected usually up to 400 feet (some systems 1000 feet). Leak sound does dissipate over distance especially where pipe materials changes from metal to plastic and back. • User detection skills improve with experience. In time, history and knowledge of background noise sources helps discern between leak and other noise. • Pinpointing leaks normally accomplished by one technician and leak noise correlator in between 30-90 minutes. • Correlators can be compromised by daytime noise. Mixed results from overnight correlation units.
How Continuous Acoustic Monitoring Works • Monitor “listens” and identifies the minimum sound in intervals in early morning hours. • The single nightly data point broken down into frequencies associated with leak noise and shows the leak noise frequencies . • The monitor reports on highest differential between lowest noise displayed and highest overnight sound. • The software interprets changes and magnitude of sounds to rate the location as a possible source of a leak.
Continuous Leak Survey Data There is a typical brief initial noise peak as leaking pipe smoothes and moves soil away from pipe The software displays a history showing the noise level at each day.
Find the Leak that Never Surfaces This leak was destined to flow to the nearby river or into the storm sewer above without coming to the surface for years. Found by acoustic monitoring
Initial Results 2005 • 487 MLOG leak detecting sensors were installed in Connellsville in Spring 2005. • From June to December 2005 46 leaks were reported in Connellsville (18 in 2003, 12 in 2004). • 24 of the 46 leaks were identified by acoustic monitors and repaired in advance of surfacing. Another 10 were MLOG identified before surfacing but appeared before repair made. The remaining 12 surfaced and were repaired. • With the reduction of blowoff flow and leaks, flow is consistently down about 255,000-285,000 gpd in 2006.
Piloting Results Connellsville 2005-2008 • 200 leaks occurred during period of which 154 detectable. Undetectable leaks largely due to sudden breaks. • Of the 154 leaks, 64 (42%) were detected and repaired before surfacing and 31 (20%) were detected acoustically but surfaced before repairs were made. • The major cause for not detecting overnight leaks (38%) is believed to be the use of plastic and repair clamps for ferrous pipe main repairs that lessen leak noise transmission.
Evaluating the Benefits/Costs of AMI-Based CAM • Significant leakage and non-revenue water? • Minimal payback if there are few leaks to find • What kind of leakage? • Acoustic monitoring best at finding hidden leakage • How much are leaks costing? • Beneficial if your water is expensive and/or scarce. • Staff/crews available to pinpoint, repair promptly?
Backflow Alerts • Water running backwards is a sign of poor operation, emergency or improper customer activity • Intelligent meters are capturing backflow alarms internally • The WaterRF project demonstrated the feasibility of direct alarms to alert operators of system problems • “Backflow alerts” also provided indication of meter issue.
Field Test Results – PA system • Installed 60 backflow meters out of 5000 meters – locations strategically selected • Found 13 instances of backflow in one year from six locations • 24 instances, 11 locations in 2 years • Some patterns from main breaks • Several locations suggest pump surge issues and warrant further investigation
Other Monitoring applications • Continuous Water Pressure Monitoring • Useful method to calibrate hydraulic model or spot system anomalies • Unexpected low pressure during high flow periods suggests unexpected demand (theft?) or poor hydraulic conditions (low C factors or closed valves) • Unexpected low pressure during all flow conditions suggests leakage. • Could place on hydrants and equip with alarms to spot authorized and unauthorized hydrant use
Other Monitoring applications • Water Temperature Monitoring • Changes in temperature (associated with surface water supplies in temperate climates) may be a trigger for water main failures • Abnormal changes in temperature may indicate higher flow into an area or water quality issue.
Water Quality Monitoring and Drinking Water Security • Monitoring as a precaution to threats • Intentional: • Physical - (i.e. arson, cyber-attack, sabotage, terrorism, vandalism) • Psychological - (i.e. hoaxes, incitement of panic, misinformation) • Unintentional: • Intrinsic system failure- Computer and system component failures • Cascading effect failures- Source water contamination from chemical spills, power loss Early warning could avoid or mitigate impact of such attacks
Deploying Water Quality Monitors • What parameters to monitor • Types of monitors - Contaminant detection, communications & reliability • On-line data management (alarms) • Selecting sites for sensor deployment • Cost estimates for sensor deployment
100 90 Uncorrected 80 Corrected (5%-25%) 70 60 Deleted (>25%) Percent Adjustment 50 40 30 20 10 0 Temp SC pH ORP DO Turbidity Chlorine (212,846) (212,778) (110,135) (212,846) (150,468) (132,308) (132,308) Sensor (number of measurements) Sensor Reliability
Making Sense of Sensors • Determining anomalies (alarms) from WQ data: • Need to identify baseline water quality information & understand sensitivity • Have sound sensor QC to determine performance issues • Ascertain impact of environmental or operational parameters on baseline • Define degree of deviations from baseline that would constitute an alarm
Sensor Location • Cost of Units forces optimization • Contaminant concentration • Injection site • Duration (or rate) of injection • Exposure All non-zero demand nodes assumed to be equally vulnerable to introduction of the biological or chemical contaminants. Time delay from detection to implementation of a mitigation response assumed to be zero. Practical Locations Optimal Locations
Actuators: Remote Shutoff Valves • Can be operated by fixed network and mobile AMI • Open, closed and “trickle” position • Self-exercising • Issues with installation, regulations, cost.
Shutoff Valve Economics • High cost to install throughout a system • Units are expensive • Risk of vandalism • Cost to adjust plumbing • Control units have cost • Where is the payback • Potentially useful for property transfers, vacation properties, collections, multiple feed customers.
AMI Can Improve Hydraulic Models • Demand analysis • Pressure Monitoring AMI Fostering the Merger of Model & Ops • System Anamolies
Hydraulic Models and Demand • Customer accounts can be assigned by code to nodes in model and hourly interval data can be derived by AMI and incorporated • Average day • Peak day • Variations for temperature/season • Use in a neighborhood can be assigned for projecting growth
Pressure Monitoring • System pressures can be gathered from field monitors to find anomalies. • Low pressure regardless of demand suggests continuous flow (leakage) • Low pressure that follows high demand suggests closed valves, lower C valves in pipes • Sudden drops in pressures at some sites (like hydrants may help identify illegal water use
Ultimate Modeling • Pressure and use can follow predictable patterns depending on day of week, temperature and recent precipitation. • Imagine dialing into model these parameters and obtaining predicted levels of pressure and flow and comparing to field data. • Sudden deviations from model can be used to track leaks, maintenance activities (flushing) and other unusual events. • Impacts of new mains, pump changes can be evaluated and model recalibrated.
Questions Dave Hughes david.hughes@amwater.com 856 346 8320
AMR/AMI Technology Risk Management Technical obsolescence Lack of standards Lack of interoperability Application and third party software Battery life Excessive failure rates; system failures, product recalls Radio frequency incursion Programming errors