Download
1 / 20
200 likes | 217 Vues
This paper presents the initial operation and current status of the X-ray Imaging Spectrometer (XIS) onboard the Suzaku satellite. The XIS consists of three cameras (XIS0, XIS2, XIS3) with CCD operation temperature of -90℃ and an energy range of 0.2-12keV. The calibration tasks include verifying the energy scale, charge transfer inefficiency, quantum efficiency, and background. The paper also discusses the determination of CTI parameters and the energy scale correction. More than 100 objects have already been observed with the XIS, which is functioning properly.

E N D
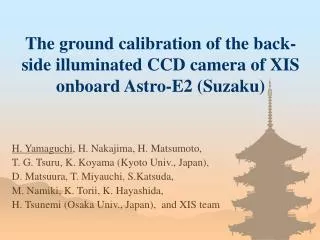
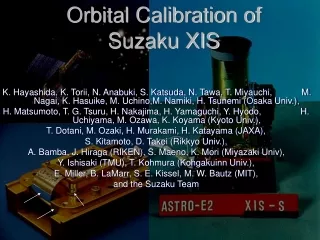
Orbital verification of the performance of Suzaku XIS K. Hayashida, K. Torii, M. Namiki, N. Anabuki, S. Katsuda, N. Tawa, T. Miyauchi, H. Tsunemi, Osaka Univ. (Japan); H. Matsumoto, T. G. Tsuru, H. Nakajima, H. Yamaguchi, K. Koyama, Kyoto Univ. (Japan); T. Dotani, M. Ozaki, H. Murakami, H. Katayama, Japan Aerospace Exploration Agency (Japan); S. Kitamoto, Rikkyo Univ. (Japan); H. Awaki, Ehime Univ. (Japan); T. Kohmura, Kogakuin Univ. (Japan); B. LaMarr, E. Miller, S. E. Kissel, M. W. Bautz, R. F. Foster, Massachusetts Institute of Technology
X-ray Imaging Spectrometer (XIS) • X-ray CCD Cameras onboard Suzaku • 3 Cameras (XIS0,XIS2,XIS3) contains FI-CCD、1 Camera(XIS1) has BI-CCD • CCD Operation Temp = -90℃ • 1024x1024pixels • FOV18’x18’ • Energy Range 0.2-12keV
Initial Operation and Current Status • 2005/7/10 Suzaku Launch • 2005/7/25 XIS System Power On • 2005/8/12-8/13 XIS Door Open =First Light • 2006/05/31More than 100 objects were observed. 4 CCD Cameras are functioning properly. E0102-72 JAXA press release
~0.5keV incident BI Small tail component!
Chemisorption Process Burke et al., 2004, IEEE transactions on Nuclear Science, 51, p.2322
すざくXIS • 7/10 0パス非可視で電磁バルブの開閉。 • 7/11 電磁バルブの開(4パス)閉(5パス)。 • 7/21 温度を上げてバルブ開。 • 7/24 MPU, PPU立ち上げ。 • 7/25 AE立ち上げ。データ取得開始(frame mode) • 7/26 CCD設定温度:−60℃ • 7/27 CCD設定温度:−90℃(ノミナル動作温度) • 8/11 CCD設定温度: −80℃。HP設定温度: −35℃。 • 8/12 XIS-3ドア開。 • 8/13 XIS-2,1,0 ドア開。 Better Energy Resolution at Low Energies
Suzaku Team Compiled by Fujimoto et al.
Orbital Calibration Items • Energy Scale • Tracking evolution of Charge Transfer Inefficiency (CTI) • Verification of Energy Scale in orbit • Quantum Efficiency • Verification of QE measured on ground • Monitoring possible change of QE in time • Background • Energy Resolution and Response Profile Updating Calibration Data Base continuously. Software tools are also required to be updated.
Ex-PHA relation (Calibration on ground) Residual to straight line fit Residual to broken line fit +10eV -10eV Si K edge (E=1839 eV)
Mn-Ka 5.9keV Mn-Kb 6.5keV 55Fe Cal-Source→Gain monitor counts • Gain Decrease ~2%/year • Energy Resolution 140eV ->170~180eV CTI increase induced by orbital radiation damage of the CCD PH [ch] Peak ch of Mn-Ka (Normalized to the ch at 1st ligt) Energy Resolution FWHM@5.9keV
Determination CTI parameters included in rev0.6 data Q’ = Q(1-CTI)N → CTI = (Q- Q’) / Q / N Q = PHA(ACTY=0) Q : Initial charge Q’ : Readout charge N : Number of P transfer PHA(Y=0) – PHA (Y=896, T) PHA(Y=0)×896 Whole Area cal src data (8/11) CTI = CTI(Seg1) = CTI(Seg 2) = [CTI(Seg0) + CTI(Seg3)] / 2 Corner cal src data (8/15~11/20) CTI = CTI_CONST + CTI_NORM×(PHAS)CTI_POW In rev0.6… CTI_POW = -0.5 CTI_CONST = 0 T Q’(T) = PHA(ACTY=896, T)
1% 1% <2% at lower energy, <1% at higher energy side. Revised correction (rev0.7 processing) is almost ready now. • Rev0.6 Correction as a function of time, location, assuming • CTI energy dependence Ex^-0.5 • CTI is constant at ACTY=0 Energy Scale Correction (Charge Trail&CTI) Cyg Loop Galactic Center Sgr C XIS0 , XIS1, XIS2 , XIS3 XIS0 , XIS1, XIS2 , XIS3 line center energy [keV] line center energy [keV] broken line: expected energy broken line: expected energy ACTY ACTY
By S.Okada et al., XRT team 20060213 QE + XRT effective area verification with Crab
QE (low energy part)CalibrationRXJ1856.5-37542005/10/24-26 Isolated NS C-K edge ~0.3keV Rev0.3 data -10eV offset 63.5eV blackbody a: Based Cal on the Ground b: a x excess0.15mmC c: Dead Layer =Design Value d: c x excess0.15mmC >0.3keV 1/3-1/2 of expected value
NeIX OVIII NeX MgXI OVII 2005-08-13 2005-08-31 2005-12-16 2006-01-17 2006-02-02 E0102-72 Repeated Observation→Degradation of QE • E0102: SNR in SMC, bright in soft X-ray lines • excellent calibrator for low-E gain, QE changes model thermal bremss + 24 Gaussian emission lines Galactic + SMC absorption pure C absorption from contaminant (varabs) gain shift -5 eV ~ -15 ev r2 ~ 1.6 (FIs) to 2.5 (BI)
Low background level is confirmed →Efficient for low surface brightness
Night Earth BGD Spectra 2 4 6 8 10 Ex (keV)
Cut-off Rigidity dependent BGD Light Curve XIS1 NEP blank sky (2005/9/2) 5-10keV count rate vs COR XIS0XIS1XIS2XIS3 0.1-5.0keV Count rate 5.0-14.9keV COR Time (s)
Summary • 4 XIS CCD cameras are functioning properly • More than 100 targets were observed already. • Gain and energy resolution are monitored with built-in calibration source. CTI correction to compensate radiation damage induced gain decrease (~2%/year) is introduced. • Energy scale error in rev0.6 processing is 1%-2%. Rev0.7 processing with higher accuracy is now almost ready to use. • QE at high energy is almost as expected (error ~10%) from Crab data. • Low energy QE suffers significant degradation. • Possibly C-dominant material put on Optical Blocking Filter (OBF) • (Details will be presented in a separate paper) • Activity to update calibration and their tool is under going.