Download
1 / 1
10 likes | 141 Vues
cross-interval in msec. 9-1. 9-2. 11-1. RTHM Scatterplot. 1 . 11-2. 2 . ISIH. 3 . 11-3. 11-4. 5 . 4 . ranked mean local ISI. Interspike Intervals. cross-interval in msec. cross-interval in msec.

E N D
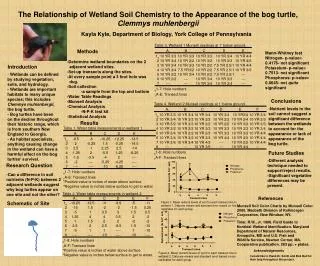
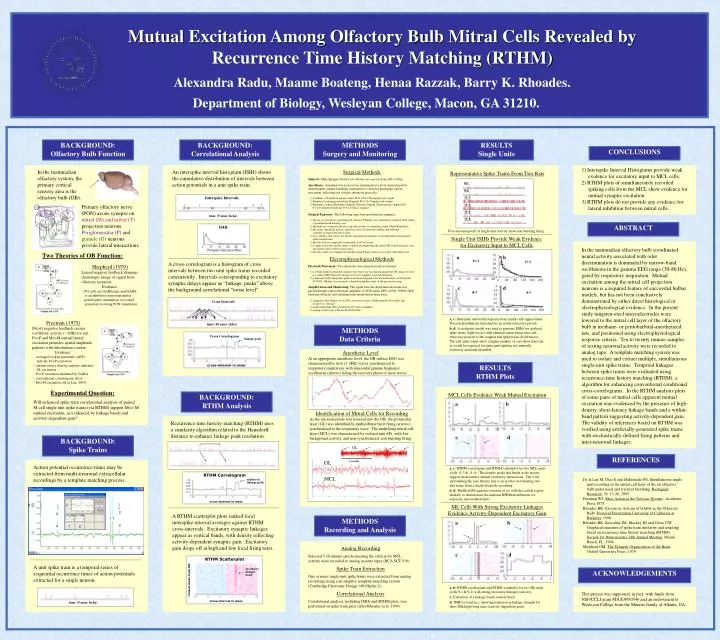
cross-interval in msec 9-1 9-2 11-1 RTHM Scatterplot 1 11-2 2 ISIH 3 11-3 11-4 5 4 ranked mean local ISI Interspike Intervals cross-interval in msec cross-interval in msec Mutual Excitation Among Olfactory Bulb Mitral Cells Revealed by Recurrence Time History Matching (RTHM) Alexandra Radu, Maame Boateng, Henaa Razzak, Barry K. Rhoades. Department of Biology, Wesleyan College, Macon, GA 31210. BACKGROUND: Olfactory Bulb Function BACKGROUND: Correlational Analysis METHODS Surgery and Monitoring RESULTS Single Units CONCLUSIONS . 1) Interspike Interval Histograms provide weak evidence for excitatory input to MCL cells. 2) RTHM plots of simultaneously recorded spiking cells from the MCL show evidence for mutual synaptic excitation. 3) RTHM plots do not provide any evidence for lateral inhibition between mitral cells. In the mammalian olfactory system, the primary cortical sensory area is the olfactory bulb (OB). An interspike interval histogram (ISIH) shows the cumulative distribution of intervals between action potentials in a unit spike train. Surgical Methods Subjects: Male Sprague-Dawley rats (Rattus norvegicus) from 180 to 450g Anesthesia: Anesthesia for each rat was maintained at a level characterized by dilated pupils, regular breathing, insensitivity to deep leg pinch pain, and no movement, following one of three anesthesia protocols: 1) Urethane (125mg/ml in normal saline) IP @ 1200-1500 mg/kg body weight 2) Nembutal (sodium pentobarbital 50mg/ml) IP @ 50-75mg/kg body weight 3) Ketamine cocktail (Ketamine 60mg/ml, Xylazine 6mg/ml, Acepromazine 1mg/ml) IM @ 0.2-0.4ml plus Nembutal @ 0.2-0.3ml as required. Surgical Exposure: The following steps were performed in sequence: 1) the rat was placed on a warming pad (Gaymar T/Pump), on a mechanical isolation table within a grounded mesh Faraday cage 2) the head was secured in the nose clip and ear bars of stereotaxic frame (David Kopf Instr.) 3) the scalp, superficial muscle, and fascia were cut down the midline and reflected laterally to expose the dorsal skull 4) two stainless steel screws for electrical ground and reference were implanted in the parietal and/or nasal bones 5) the left orbit was surgically exenterated of all soft tissue 6) a surgical drill was used to open a window encompassing the lateral OB, lateral olfactory tract, and anterior pole of the frontal cortex 7) the dura mater was stripped off and the exposed brain surface was coated with mineral oil Electrophysiological Methods Electrode Placement: Two electrodes were stereotaxically positioned: 1) a 250um formvar-insulated stainless steel wire loop was placed against the OB surface to serve as a surface EEG electrode and presser foot to suppress vascular pulsations 2) a electrolytically-sharpened, parlene-insulated tungsten-steel microelectrode (A-M Systems #575500, 5Mohm) was lowered to depth through the center of the presser-foot ring Amplification and Monitoring: The signal from the depth microelectrode was passed through a microelectrode amplifier (A-M Systems 1800; x1000; 500Hz-5kHz band-pass filtered) and simultaneously monitored in three ways: 1) computer video display via an A/D conversion system (ADInstruments PowerLab 8sp; Scope 5.11 software) 2) audio monitoring (RCA model SA-155 stereo amplifier) 3) analog oscilloscope (GW model GOS-622G) Representative Spike Trains From Two Rats TGase1 Positive rat brain Primary olfactory nerve (PON) axons synapse on mitral (M) and tufted (T) projection neurons. Periglomerular (P) and granule (G) neurons provide lateral interactions. time (5 msec ticks) ABSTRACT Five-second epochs of single unit activity show non-bursting firing. Single Unit ISIHs Provide Weak Evidence for Excitatory Input to MCL Cells In the mammalian olfactory bulb coordinated neural activity associated with odor discrimination is dominated by narrow-band oscillations in the gamma EEG range (30-80 Hz), gated by respiratory inspiration. Mutual excitation among the mitral cell projection neurons is a required feature of successful bulbar models, but has not been conclusively demonstrated by either direct histological or electrophysiological evidence. In the present study tungsten-steel microelectrodes were lowered to the mitral cell layer of the olfactory bulb in urethane- or pentobarbital-anesthetized rats, and positioned using electrophysiological response criteria. Ten to twenty minute samples of resting neuronal activity were recorded to analog tape. A template matching system was used to isolate and extract multiple, simultaneous single-unit spike trains. Temporal linkages between spike trains were evaluated using recurrence-time history matching (RTHM), a algorithm for enhancing conventional conditional cross-correlograms. In the RTHM analysis plots of some pairs of mitral cells apparent mutual excitation was evidenced by the presence of high-density, short-latency linkage bands and a within-band pattern suggesting activity-dependent gain. The validity of inferences based on RTHM was verified using artificially-generated spike trains with stochastically-defined firing patterns and inter-neuronal linkages. Two Theories of OB Function: a b 11-1 A cross-correlogram is a histogram of cross intervals between two unit spike trains recorded concurrently. Intervals corresponding to excitatory synaptic delays appear as “linkage peaks” above the background correlational “noise level”. Shepherd (1979) Lateral negative feedback sharpens chemotopic image of signal from olfactory receptors. Evidence: - PG cells are GABAergic and GABA is an inhibitory neurotransmitter - paired-pulse attenuation of evoked potentials to strong PON stimulation c d 9-1 Cross Intervals a, c: Interspike interval histograms from mitral cells approximate Poisson distributions truncated by an initial refractory period. b, d: A stochastic model was used to generate ISIHs for artificial spike trains (light traces) with identical mean firing rates and refractory periods to the original real spike trains (bold traces). The real spike trains show a higher number of very short intervals, as would be expected for units participating in a mutually excitatory neuronal ensemble. Freeman (1975) M<>G negative feedback creates oscillatory activity (~ 60Hz for rat). P<>P and M<>M mutual lateral excitation promotes spatial amplitude patterns with information content. Evidence: - averaged evoked potentials (AEP) indicate P<>P excitation - current source density analysis indicates GL excitation - P<>P excitation mediated by GABA - conventional correlograms show M<>M excitation (de la Luz, 2005) time (10 msec ticks) METHODS Data Criteria Cross Correlogram linkage peak Anesthetic Level At an appropriate anesthetic level, the OB surface EEG was characterized by slow (1-3HZ) waves synchronized to respiratory inspiration, with sinusoidal gamma frequency oscillations (arrows) riding the recovery phase of most waves. . RESULTS RTHM Plots Experimental Question: MCL Cells Evidence Weak Mutual Excitation BACKGROUND: RTHM Analysis Will enhanced spike train correlational analysis of paired M cell single unit spike trains (via RTHM) support M<> M mutual excitation, as evidenced by linkage bands and activity-dependent gain? a b Identification of Mitral Cells for Recording As the microelectrode was lowered into the OB, the glomerular layer (GL) was identified by multicellular burst firing (arrows) , synchronized to the respiratory wave. The underlying mitral cell layer (MCL) was characterized by isolated unit APs, with low background activity, and non-synchronized, non-bursting firing. Recurrence time history matching (RTHM) uses a similarity algorithm related to the Hausdorff distance to enhance linkage peak resolution. c d BACKGROUND: Spike Trains GL REFERENCES GL 1 second Action potential occurrence times may be extracted from multi-neuronal extracellular recordings by a template matching process. a, c: RTHM correlogram and RTHM scatterplot for two MCL units (cells 11-3 & 11-4). The density peaks and bands at the arrows suggest short-latency mutual excitatory interactions. The void surrounding the zero latency line is an artifact of extracting two unit trains from a single-electrode recording. b, d: Shuffled ISI sequence versions of a,c with the central region masked, to demonstrate the uniform RTHM distributions for expressly uncorrelated units. RTHM Correlogram MCL De la Luz M, Diaz E and Maldonado PE. Simultaneous single unit recording in the mitral cell layer of the rat olfactory bulb under nasal and tracheal breathing. Biological Research. 38: 13-26, 2005. Freeman WJ. Mass Action in the Nervous System. Academic Press 1975. Rhoades BK. Excitatory Actions of GABA in the Olfactory Bulb. Doctoral Dissertation,University of California at Berkeley, 1990. Rhoades BK, Kowalski JM, Mackey HJ and Gross GW. Graphical measures of spike train similarity and coupling based on recurrence time history matching (RTHM). Society for Neuroscience 24th Annual Meeting. Miami Beach, FL, 1994. Shepherd GM. The Synaptic Organization of the Brain. Oxford University Press, 1979. enhanced linkage peak ML Cells With Strong Excitatory Linkages Evidence Activity-Dependent Excitatory Gain 2 2 A RTHM scatterplot plots ranked local interspike interval averages against RTHM cross-intervals. Excitatory synaptic linkages appear as vertical bands, with density reflecting activity-dependent synaptic gain. Excitatory gain drops off at high and low local firing rates. 1 1 METHODS Recording and Analysis a b 2 2 1 2 . Analog Recording Selected 5-10 minute epochs meeting the criteria for MCL activity were recorded to analog cassette tapes (RCA SCT-510). Spike Train Extraction One or more single-unit spike trains were extracted from analog recordings using a an adaptive template-matching system (Cambridge Electronic Design 1401/Spike-2). Correlational Analysis Correlational analysis, including ISIHs and RTHM plots, was performed on spike train pairs (after Rhoades et al, 1994). c d A unit spike train is a temporal series of sequential occurrence times of action potentials extracted for a single neuron. excitatory linkage band ACKNOWLEDGEMENTS a, b: RTHM correlogram and RTHM scatterplot for two ML units (cells 9-1 & 9-2) with strong excitatory linkages (arrows). c: Extraction of a linkage band (vertical lines) d: ISIH for band in c, showing reduction in linkage strength for short ISIs/high firing rates (activity-dependent gain). This project was supported, in part, with funds from NSF/CCLI grant #DUE9950546 and an endowment to Wesleyan College from the Munroe family of Atlanta, GA. time (5 msec ticks)