Neuromuscular Dynamics of Triceps Tendon Tapping in Stroke Patients vs. Controls
This study investigates the differences in neuromuscular responses to triceps tendon tapping in patients with stroke compared to nondisabled controls. Conducted with the elbow joint at 90° flexion, the results indicate distinct patterns in electromyography (EMG) responses, visualized through mean and standard deviation lines. The findings contribute to understanding hyperactive reflexes post-stroke and can inform rehabilitation strategies. The research was published in the Journal of Rehabilitation Research and Development in 2011.

Neuromuscular Dynamics of Triceps Tendon Tapping in Stroke Patients vs. Controls
E N D
Presentation Transcript
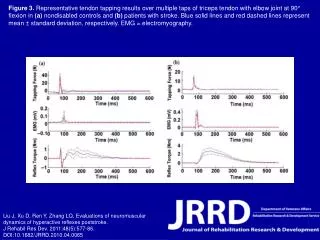
Figure 3. Representative tendon tapping results over multiple taps of triceps tendon with elbow joint at 90° flexion in (a) nondisabled controls and (b) patients with stroke. Blue solid lines and red dashed lines represent mean ± standard deviation, respectively. EMG = electromyography. Liu J, Xu D, Ren Y, Zhang LQ. Evaluations of neuromuscular dynamics of hyperactive reflexes poststroke.J Rehabil Res Dev. 2011;48(5):577-86.DOI:10.1682/JRRD.2010.04.0065