Download
1 / 41
410 likes | 556 Vues
6. Grid. Positional Accuracy: degree of error between a modeled location (as seen in the GIS) and the actual location. 1. Relative Accuracy- relationship between visible spatial objects is correct 2. Absolute Accuracy- position of each spatial object is

E N D
Positional Accuracy: degree of error between a modeled location (as seen in the GIS) and the actual location. 1. Relative Accuracy- relationship between visible spatial objects is correct 2. Absolute Accuracy- position of each spatial object is location is exact Component Accuracy: completeness and integrity of all spatial & attribute data ie. When were the parcel objects updated to show changes? Does the attribute data include updated data for this year? Does your map only show the “positives” and not potential problems? (Read – “How to Lie with Maps”).
Relative Accuracy: Absolute Accuracy: Fire hydrant #22 is located west of Richie Dr. & south of #21 and north of #23 Fire hydrant #22 is located at 41.145367 N , 81.98634 W
Factors that can affect the positional accuracy of spatial data input: 1. Survey monuments 2. Global Positioning System (GPS) 3. Map scale 4. Map projection
Survey monuments: 2 to 3” pin in road, ground, etc. that was surveyed- has some known x,y location values and elevation The monuments are used as control points for data input. More monuments allows for more controls points and more positional accuracy
Global Positioning System 24 satellites in earth orbit GPS unit/ receiver GPS: captures locational positions within 1 cm to few hundred yards can increase control points & thus increase the positional accuracy of spatial objects in the data input process
Map Scale: measure of the distance on the paper map representing the distance in real world If map is digitized at a scale of 1” = 50’, will the digitized product be more positionally accurate than a map digitized at a scale of 1” = 5000’???? 1”= 5,000’ 1”= 50’
Map Projections: process to transform 3 dimensional surface to a 2 dimensional surface Map projections will emphasize different aspects of accuracy: Equal area projections display the geographic areas to show relative size Directional projections allow navigation from place to place If the study area for the GIS project is a “small” geographic area, any map projection is acceptable for data input: Equal Area Projection Directional Projection
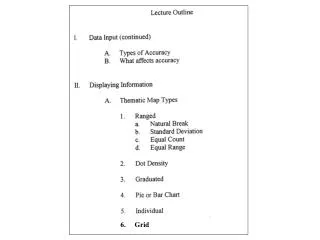
Display Information using Thematic Maps: • Process of shading your map according to a theme • Shading can be by color, black & white, patterns, dots, or symbols • Uses values of data to allow comparisons of data and see patterns • Variety of thematic options to display the same data. • Thematic map types: • Ranged • Dot Density • Graduated • Pie or Bar chart • Individual • Grid
Thematic maps: - Use number values or nominal values - Nominal values are name values and are usually character fields ie. In a basement flooding database, a field called condition may have the value of Flood or Not Flood - Data displayed on the map is called a thematic variable - In most thematic maps, one variable is mapped, however 2 or more variables can be mapped. • Thematic map types: Ranged, Dot Density, Graduated, Pie or Bar chart, Individual, Grid
RangedThematic maps: • displays data according to values grouped together • 4 classifications of Ranged thematic maps • Natural Break • Standard Deviation • Equal Count • Equal Range
RangedThematic map: Natural Break: Shows data that is NOT evenly distributed, patterns can be seen 100 75 50 25 0 • sort data by value • data values clustered • groups by slope • determines range cutoff values • unbiased, scientific method to • determine ranges V A L U E 58 42 8 0 5 10 15 20 OBSERVATION (SORTED BY VALUE)
RangedThematic map: Standard Deviation: Shows data that is NOT evenly distributed, patterns can be seen mean 1 standard deviation 75 50 25 0 • calculates mean (average) of data values - calculates variance (value of each item minus • the average) - square the deviation (or change from average) • for each data item • - divide by number of data items minus 1 • (variance) - take square root of variance= standard deviation • - each standard deviation above/ below are used to • determine the set of ranges in the thematic map • - unbiased, scientific method to determine ranges 0 100 200 300 400 500
Equal Count: Same number of records are placed in each range Good to use if you need number of data records divided into equal amounts. ie. You want the same number of tracts in each range so that you can assign 4 workers an equal work load for research in more detail.
Equal Range: Divides the records across ranges of equal size Good to use if you need to determine how many records fall within each range of equal size ie. You want the number of tracts in each equal interval range.
6. Grid • Dot density : • uses dots to represent data value • associated with a polygon • only used with polygons • very useful map type to show • densities of values
Total number of dots represent • the polygon’s data value • ie. Population by city • Pop. in Berea = 15,000 people • if 1 dot = 150 persons, there • should be 100 dots in the • polygon for Berea. Ways to change how data is displayed on dot density maps: 1. Dot value 2. Dot size 3. Dot color 4. Dot shape
Changing the Dot value Which dot value shows population densities best??? 1 dot = 1000 persons 1 dot = 150 persons 1 dot = 300 persons
Dots too small Dots too large Which dot density map shows the densities best???? Value too small Value too large Dot value & size- just right
6. Grid • Graduated : • uses symbols to represent different • data values • can be used with points, lines, or polygons • works best with numeric values
Graduated example: : • uses varying symbol size to represent • different population values per city • used with city polygons • works best with numeric values for • the size of circle
6. Grid • Pie or Bar Chart : • uses pie or bar to represent different • data values • used with polygons only • can use numeric & nominal values
Pie Chartexample: • uses pie size to represent different • population data values • and uses black & light gray to • represent male or female • uses with city polygons • uses numeric (population) • & nominal values (male/ female) Males Females
Same data values but uses bars instead of pies
6. Grid • Individual : • Shows points, lines, or polygons • by their unique value • used with points, lines, or polygons • can use numeric or nominal values
Individual : • Shows neighborhood polygons • by their unique condition value • used with polygons • using nominal values
6. Grid • Grid : • Shows gradational change from • centroid of polygon • used with polygons • uses numeric values
Thematic Map- Grid • Grid example: : • Shows gradational change of • population from • centroid of polygon • used with tract polygons • uses numeric values • colors are based interpolated • values between centroids
Maps can mislead if you are not careful or are unscrupulous. Read the following exert from “How to Lie with Maps”