KROMATOGRAFİ
KROMATOGRAFİ. Kromatografi güçlü bir ayırma metodudur. 12. Yüzyılın başında Rus botanikçisi Mikhail Tswett tarafından bulunmuştur. Çeşitli bitki pigmentlerni kalsiyum karbonat ile dolu olan bir cam kolondan geçirerek ayırmıştır. Kolon içindeki maddeler renkli bantlar oluşturmuşlardır.

KROMATOGRAFİ
E N D
Presentation Transcript
Kromatografigüçlü bir ayırma metodudur. 12. Yüzyılın başında Rus botanikçisi Mikhail Tswett tarafından bulunmuştur. Çeşitli bitki pigmentlerni kalsiyum karbonat ile dolu olan bir cam kolondan geçirerek ayırmıştır. Kolon içindeki maddeler renkli bantlar oluşturmuşlardır. Chroma ( yunancadarenki anlamına gelir)
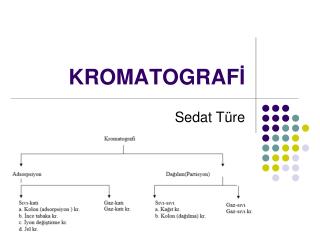
KROMATOGRAFİNİN GENEL TANIMI • Sabit Faz (SP): Kolon dolgu maddesi • Hareketli Faz (HP): Kolon içinde maddenin taşınmasını sağlayan gaz ya da sıvı • Analit: araştırlan madde Sabit Fazda güçlü bir şekilde tutulanlar yavaş ilerlerler. Zayıf bir şekilde tutunanlar ise hızlı bir şekilde kolon içinde hareket ederler. Bu şekilde örneğin farklı bileşenleri kolon içinde ayrışırlar. Bu şekilde kualitatif ve kuantitatif analiz yapmak mümkündür.
Kromatografikmetodların sınıflandırılması Kolon kromatografisi: Dolgu maddesi bir kolon içindedir ve mobil faz ile hareket sağlanır Planarkromatografi: Dolgu maddesi bir plake üzerine tutturulmuştur ve madde kapileraction ile hareket eder. • Column Chromatography • Liquid chromatography • Mobile phase is a liquid solvent • Gas chromatography • Mobile phase is a carrier gas • Supercritical fluid chromatography • Mobile phase is a supercritical fluid • Planar chromatography • stationary phase is supported on a flat plate or in the pores of a paper (e.g. TLC)
Elutionchromatography on columns Figure 26-1 (a) Diagram showing the separation of a mixture of components A and B by column elution chromatography, (b) The output of the signal detector at the various stages of elution shown in (a).
Elutionchromatography on columns Analyte Dilution Figure 26-1 illustrates an important general characteristic of the separation process—namely, dilution of analytes nearly always accompanies separations. Thus, the size of the original zone containing the analytes in the figure is noticeably smaller than either of the two zones that reach the detector, meaning that significant dilution of the analytes has occurred while they were being separated. As a result, the detectors employed for separated analytes must often be more sensitive than would be required if the separation process was unnecessary. Chromatograms If a detector that responds to solute concentration is placed at the end of the column and its signal is plotted as function of time (or of volume of the added mobile phase), a series of peaks is obtained, as shown in the lower part of Figure 26-1. Such a plot, calleda chromatogram, is useful for both qualitative and quantitative analysis. The positions of peaks on the time axis may serve to identify the components of the sample; the areas under the peaks provide a quantitative measure of the amount of each component.
Chromatograms If a detector that responds to solute concentration is placed at the end of the column and its signal is plotted as function of time (or of volume of the added mobile phase), a series of peaks is obtained, as shown in the lower part of Figure 26-1. Such a plot, calleda chromatogram, is useful for both qualitative and quantitative analysis. The positions of peaks on the time axis may serve to identify the components of the sample; the areas under the peaks provide a quantitative measure of the amount of each component.
Elutionchromatography on columns The Effects of Migration Rates and Zone Broadening on Resolution Figure 26-2 shows concentration profiles for solutes A and B at an early (t1) and late t2) stage of elution from the chromatographic column. Species B is more strongly retained; thus, B lags during the migration. It is apparent that movement downthe column increases the distance between the two zones. At the same time, however, broadening of both zones takes place, which lowers the efficiency of the column as aseparating device. While zone broadening is inevitable, conditions can ordinarily be found where it occurs more slowly than band separation. Thus, as shown in Figure 26-1, a clean resolution of species is often possible provided the column is sufficiently long.
Elution chromatography on columns The Effects of Migration Rates and Zone Broadening on Resolution Conditionshave been altered so that the first component moves down the column at a faster pace and the second at a slower. In Figure 26-3c the rates of zone broadening for the two species have been decreased. Both of these measures clearly lead to a cleaner separation.
MIGRATION RATES OFSOLUTES Distribution Constants Often, the distribution equilibria involved in chromatography are described by relatively straightforward equations that involve the transfer of an analyte between the mobile and stationary phases. Thus, for the solute species A, we may write The equilibrium constant K for this reaction is called the distribution constant, the partition ratio, or the partition coefficient,and is defined as where cS is the molar concentration of the solute in the stationary phase and cm is its molar concentration in the mobile phase. Ideally, K is constant over a wide range of solute concentrations; that is, cS is directly proportional to cm.
Retention and Differential Migration in Chromatography KA KB Distribution constant (partition ratio, partition coefficient): • Note: the arrows represent “approximate” equilibration
Retention Time The time it takes after sample injection for the analyte peak to reach the detector is called the retention timeand is given the symbol tR. The small peak on the left is for a species that is not retained by the column. Often the sample or the mobile phase will contain an unretained species. When they do not, such a species may be added to aid in peak identification. The time tM for the unretained species to reach the detector is sometimes called the dead time. The rate of migration of the unretained species is the same as the average rate of motion of the mobile phase molecules. The average linear rate of solute migration is where L is the length of the column packing. Similarly, the average linear rate of movement u of the molecules of the mobile phase is where tMthe dead time, is the time required for an average molecule of the mobile phase to pass through the column. Figure 26-4 A typical chromatogram for a two-component mixture. The small peak on the left represents a species that is not retained on the column and so reaches the detector almost immediately after elution is started. Thus its retention time tm is approximately equal to the time required for a molecule of the mobile phase to pass through the column.
Retention time The time it takes after sample injection for the analyte peak to reach the detector is called the retention timeand is given the symbol tR. The small peak on the left is for a species that is not retained by the column. Often the sample or the mobile phase will contain an unretained species.The small peak on the left is for a species that is not retained by the column. Often the sample or the mobile phase will contain an unretained species. Figure 26-4 A typical chromatogram for a two-component mixture. The small peak on the left represents a species that is not retained on the column and so reaches the detector almost immediately after elution is started. Thus its retention time tm is approximately equal to the time required for a molecule of the mobile phase to pass through the column.
Retention time The average linear rate of solute migration is where L is the length of the column packing. Similarly, the average linear rate of movement u of the molecules of the mobile phase is
Detector Peaks in Separation Sciences • Peak shapes in separation sciences are generally Gaussian in nature, reflecting the fundamental nature of the processes at work (e.g. diffusion) • In practice, real peaks are generally slightly asymmetric • Fronting peaks • Tailing peaks Gaussian Tailing Fronting
The Definition of Plate Height The breadth of a Gaussian curve is directly related to the variance σ2 or the standard deviation σ of a measurement. Because chromatographic bands are generally assumed to be Gaussian in shape, it is convenient to define the efficiency of a column in terms of variance per unit length of column. That is, the plate height H is given by
Kinetic Variables Affecting Zone Broadening The magnitude of kinetic effects on column efficiency clearly depends upon the length of time the mobile phase is in contact with the stationary phase, which in turn depends upon the flow rate of the mobile phase.For this reason, efficiency studies have generally been carried out by determining H The Effect of Mobile-Phase Flow Rate
Relationship between Plate Height andColumn Variables Mathematical approximation of the behavior of chromatographic columns began with the studies in the 1950s by Dutch chemical engineers that led to the van Deemter equation, which can be written in the form where H is the plate height in centimeters, u is the linear velocity of the mobile phase in centimeters per second, and the quantities A, B, and C are coefficients related to the phenomena of multiple flow paths, longitudinal diffusion, and mass transfer betweenphases, respectively. As indicated on the right, the C coefficient can be broken into two coefficients, one related to the stationary phase (CS) and one related to the mobile phase (Cm).
Band Broadening Processes t0 t1 t2 later latest • Non-column Broadening • Dispersion of analyte in: • Dead volume of an injector • Volume between injector and column • Volume between column and detector • Column Broadening • Van Deemter and related model
Band Broadening Theory • Column band broadening originates from three main sources: • multiple paths of an analyte through the column packing (A) • molecular diffusion (B) • effect of mass transfer between phases (C) • In 1956, J.J. Van Deemter introduced the first equation which combined all three sources and represented them as the dependence of the theoretical plate height (H) and the mobile phase linear velocity (u)
Van Deemter “A” Term • The “A” Term: Eddy diffusion • molecules may travel unequal distances in a packed column bed • particles (if present) cause eddies and turbulence • “A” depends on size of stationary particles (small is best) and their packing “quality” (uniform is best)
mobile phase movement onto SP movement off SP Stationary phase (SP) analyte attracted onto SP Van Deemter “C” Term • Resistance to Mass Transfer: • The analyte takes a certain amount of time to equilibrate between the stationary phase and the mobile phase • If the velocity of the mobile phase is high, and an analyte has a strong affinity for the stationary phase, then the analyte in the mobile phase will move ahead of the analyte in the stationary phase • The band of analyte is broadened • The higher the velocity of the mobile phase, the worse the broadening becomes
OPTIMIZATION OF COLUMN PERFORMANCE Column Resolution The resolution Rs of a column provides a quantitative measure of its ability to separate two analytes. The significance of this term is illustrated in Figure 26-11, which consists of chromatograms for species A and B on three columns having different resolutions. Column resolution is defined as where all of terms on the right side of the equation are apparent in the figure. The resolution for a given stationary phase can be improved by lengthening the column, thus increasing the number of plates. An adverse consequence of the added plates, however, is an increase in the time required for the separation.
OPTIMIZATION OF COLUMN PERFORMANCE The Effect of Retention andSelectivity Factors on Resolution It is useful to develop a mathematical relationship between the resolution of a column and the retention factors k'A and k‘B for two solutes, the selectivity factor α, and the number of plates N making up the column. To this end, we will assume that we are dealing with two solutes A and B having retention times that are close enough to one another that we can assume Equation 26-20 then takes the form Equation 26-17 permits the expression of W in terms of (tR)Band N, which can then be substituted into the foregoing equation to give Substituting Equation 26-8 and rearranging leads to an expression for Rsin terms of the retention factors for A and B. That is,
OPTIMIZATION OF COLUMN PERFORMANCE The Effect of Retention andSelectivity Factors on Resolution Let us eliminate kA from this expression by substituting Equation 26-10 and rearranging. Thus; Often it is desirable to calculate the number of theoretical plates required to achieve a desired resolution. An expression for this quantity is obtained by rearranging Equation 26-21 to give Simplified forms of Equations 26-21 and 26-22 are sometimes encountered where these equations are applied to a pair of solutes whose distribution constants are similar Enough to make their separation difficult. Thus, when KA ~ KBit follows from Equation 26-5 that k‘A ~ k'B = k' and from Equation 26-9, α → 1. With these approximations, Equations 26-21 and 26-22 reduce to Where k‘ is the average of k‘Aandk'B.
Improving Resolution • For good resolution in separations, the three terms can be optimized Poor Rs ~ 0.8 • Increasing k (retention factor) • Change temperature (GC) • Change MP composition (LC) • Increasing N (number of plates) • Lengthen column (GC) • Decrease SP particle size (LC) • Increasing (selectivity factor) • Changing mobile phase • Changing column temperature • Changing stationary phase Increase k Rs > 1.5 Increase N Rs > 1.5 Change Rs > 1.5
Variables That Affect Column Performance Inseeking optimum conditionsforachieving a desiredseparation, it must be kept in mindthatthefundamentalparameters, α, k, and N (or H) can be adjustedmoreorlessindependently. ♦ αand k can be variedbyvaryingtemperatureorthecompositon of mobile phase ordifferenttype of columnpacking ♦Tochange N, changethelength of columnandchange H byalteringtheflow rate of the mobile phase, theparticle size, viscosity of the mobile phase (andthus DMor DS), thethickness of the film of adsorbedliquidconstitutingthestationaryphase.
OPTIMIZATION OF COLUMN PERFORMANCE Variation in the Retention Factor Figure 26-3 Two-component chromatograms illustrating two methods of improving separators: (a) original chromatogram with overlapping peaks; improvements brought about by (b) an increase in band separation, and (c) a decrease in band spread.
OPTIMIZATION OF COLUMN PERFORMANCE Variation in the Selectivity Factor When α approaches unity, optimizing k'and increasing N are not sufficient to give a satisfactory separation of two solutes in a reasonable time. Under this circumstance, a means must be sought to increase a while maintaining k'in the optimum range of 1 to 10. Several options are available; in decreasing order of theirdesirability as determined by promise and convenience, the options include: (1) changing the composition of the mobile phase, including changes in pH; (2) changing the column temperature; (3) changing the composition of the stationary phase; (4) using special chemical effects.
OPTIMIZATION OF COLUMN PERFORMANCE The General Elution Problem Figure 26-14 illustrates hypothetical chromatograms for a six-component mixture made up of three pairs of components having widely differing distribution constants and thus retention factors. In chromatogram (a), conditions have been adjusted so that retention factors for components 1 and 2 (k’1 and k'2) are in the optimal range of 2 to 5. The corresponding factors for the other components are, however, far larger than the optimum. Thus, the peaks for 5 and 6 appear only after an inordinate time; furthermore, these peaks are so broadened that they may be difficult to identify unambiguously. As shown in chromatogram (b),changing conditions to optimize the separation of components 5 and 6, bunches the peaks for the first four components to the point where their resolution is unsatisfactory. Here, however, the total elution time is ideal. A third set of conditions, in which k values for components 3 and 4 are optimal, results in chromatogram (c). Again, separation of the other two pairs is not entirely satisfactory.
OPTIMIZATION OF COLUMN PERFORMANCE The General Elution Problem The phenomenon illustrated in Figure 26-14 is encountered often enough to be given a name—the general elution problem. A common solution to this problem is to change conditions that determine the values of k' as the separation proceeds. These changes may be performed in a stepwise manner or continuously. Thus, for the mixture shown in Figure 26-14, conditions at the outset could be those producing chromatogram (a). Immediately after elution of components 1 and 2, however, conditions could be changed to those that were optimal for separating 3 and 4 (as in chromatogram c). With the appearance of peaks for these components, the elution could be completed under conditions used for producing chromatogram (b). Often such a procedure leads to satisfactory peaks for all of the components in a mixture in minimal time. For liquid chromatography, variations in k’ are brought about by variations in the composition of the mobile phase during elution (gradient elution or solvent programming). For gas chromatography, temperature increases (temperature programming) serve to achieve optimal conditions for separations.
APPLICATIONS OF CHROMATOGRAPHY Qualitative Analysis A chromatogram provides only a single piece of qualitative information about each species in a sample, namely, its retention time or its position on the stationary phase after a certain elution period. Additional data can, of course, be derived from chromatograms involving different mobile and stationary phases and various elution temperatures. Still, the amount of information obtainable by chromatography is small compared with the amount provided by a single IR, NMR, or mass spectrum. Furthermore, spectral wavelength or frequency data can be determined with much higher precision than can their chromatographic counterpart (tR). The foregoing should not be interpreted to mean that chromatography lacks important qualitative applications. Indeed, it is a widely used tool for recognizing the presence or absence of components of mixtures containing a limited number of possible species whose identities are known. For example, 30 or more amino acids in a protein hydrolysate can be detected with a relatively high degree of certainty by means of a chromatogram. Even here, however, confirmation of identity requires spectral or chemical investigation of the isolated components. Note, however, that positive spectroscopic identification would ordinarily be impossible on as complex a sample as the foregoing without a preliminary chromatographic separation. Thus, chromatography is often a vital precursor to qualitative spectroscopic analyses. It is important to note that while chromatograms may not lead to positive identification of species present in a sample, they often provide sure evidence of the absence of certain compounds. Thus, if the sample does not produce a peak at the same retention time as a standard run under identical conditions, it can be assumedthat the compound in question is absent (or is present at a concentration level below the detection limit of the procedure).
APPLICATIONS OF CHROMATOGRAPHY Quantitative Analysis Chromatography owes its precipitous growth during the past four decades in part to its speed, simplicity, relatively low cost, and wide applicability as a separating tool. Quantitative column chromatography is based upon a comparison of either the height or the area of the analyte peak with that of one or more standards. For planar chromatography, the area covered by the separated species serves as the analytical parameter. If conditions are properly controlled, these parameters vary linearly with concentration.
APPLICATIONS OF CHROMATOGRAPHY Quantitative Analysis Analyses Based on Peak Height The height of a chromatographic peak is obtained by connecting the base lines on either side of the peak by a straight line and measuring the perpendicular distance from this line to the peak. This measurement can ordinarily be made with reasonably high precision. It is important to note, however, that peak heights are inversely related to peak widths. Thus, accurate results are obtained with peak heights only if variations in column conditions do not alter the peak widths during the period required to obtain chromatograms for sample and standards. The variables that must be controlled closely are column temperature, eluent flow rate, and rate of sample injection. In addition, care must be taken to avoid overloading the column. The effect of sample injection rate is particularly critical for the early peaks of a chromatogram. Relative errors of 5% to 10% due to this cause are not unusual with syringe injection. Analyses Based on Peak Areas Peak areas are independent of broadening effects due to the variables mentioned in the previous paragraph. From this standpoint, therefore, areas are a more satisfactory analytical variable than peak heights. On the other hand, peak heights are more easily measured and, for narrow peaks, more accurately determined. Most modern chromatographic instruments are equipped with digital electronic integrators that permit precise estimation of peak areas.
APPLICATIONS OF CHROMATOGRAPHY Calibration and Standards The most straightforward method for quantitative chromatographic analyses involves the preparation of a series of standard solutions that approximate the composition of the unknown. Chromatograms for the standards are then obtained and peak heights or areas are plotted as a function of concentration. A plot of the data should yield a straight line passing through the origin; analyses are based upon this plot. Frequent restandardization is necessary for highest accuracy. The most important source of error in analyses by the method just described is usually the uncertainty in the volume of sample; occasionally the rate of injection is also a factor. Ordinarily, samples are small (-1 µL), and the uncertainties associated with injection of a reproducible volume of this size with a microsyringe may amount to several percent relative. The situation is exacerbated in gas-liquid chromatography, where the sample must be injected into a heated sample port; here, evaporation from the needle tip may lead to large variations in the volume injected. Errors in sample volume can be reduced to perhaps 1% to 2% relative by means of a rotary sample valve.
APPLICATIONS OF CHROMATOGRAPHY The Internal Standard Method The highest precision for quantitative chromatography is obtained by use of internal standards because the uncertainties introduced by sample injection are avoided. In this procedure, a carefully measured quantity of an internal standard substance is introduced into each standard and sample, and the ratio of analyte to internal standard peak areas (or heights) serves as the analytical parameter. For this method to be successful, it is necessary that the internal standard peak be well separated from the peaks of all other components of the sample (Rs > 1.25); the standard peak should, on the other hand, appear close to the analyte peak. With a suitable internal standard, precisions of better than 1% relative RSD can usually be achieved.