Precision Ag and Conservation
Precision Ag and Conservation. Precision Ag Technologies are most often developed to increase efficiency and decrease input cost However, they provide great opportunity for soil and water conservation Technologies may be used to indirectly map soils at high resolution?. Yield Maps.

Precision Ag and Conservation
E N D
Presentation Transcript
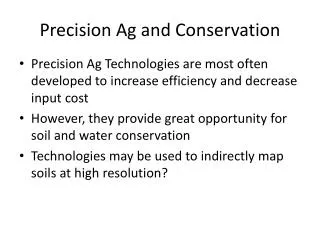
Precision Ag and Conservation • Precision Ag Technologies are most often developed to increase efficiency and decrease input cost • However, they provide great opportunity for soil and water conservation • Technologies may be used to indirectly map soils at high resolution?
Yield Maps • What controls Yield??? • Nutrient availability • Organic matter, clay content, and type • Plant available water holding capacity • Depth, texture, horizonation, and organic matter content • Soil aeration • Pest pressures • pH, salinity • A soil map should tell us many of these things
Yield Maps • Some times they can be useful • If soil mapping unit is uniform • If there are biologically (influential on yield) significant differences between mapping units in a field • Sometimes soil maps provide very little explanation of yield variability • Heterogeneous mapping units • No biologically significant differences between mapping units. • An understanding of soils and how they are mapped can be useful in interpretation
Soil Survey map • The whole field is a Taloka silt loam, which is a highly variable mapping unit
Range of Soil Characteristics for the Taloka • Depth to Redoximorphic features (indicator of wetness)=6-14 inches • Depth to clay pan=28-48 inches • Clay content=30-60% • Excellent example of a mapping unit that provides limited information for precision management. • Every acre can easily be different.
Relationship Between Limiting Layer and Yield (Ottowa Co) • Limiting layer is defined as the layer with a clay content above 35%, containing Redoximorphic features (drainage problem) • The high yielding outliers indicate that much of the field is under managed • Problems with: • Nutrients • pH • Salinity
Soil Map, Ponca City Port Silt loam is a beautiful Alluvial soil • A little bit! The Tabler and Kirkland aren’t bad but they’re not Ports
Relationship Between Limiting Layer and Yield • Restrictive layer was defined as a firm layer with a clay content greater than 35%, and a color value greater than 2. • The color component accounts for the very dark brown subsoil in the Port silty clay loam • This Port did have clay greater than 35% but organic matter content and landscape position prevented yield limitation
Small Things Add Up • Poor correlation with single variable versus yield. • What does this mean? • If you correct a single problem it probably will result in little effect on yield.
Other Precision Ag technologies and Soil Assessment • Electrical Conductivity
Electrical Conductivity • EC is related to soil texture • Will be influenced by moisture content and will therefore changed over time. • Will of course be influenced by Salinity • However, patterns should be consistent. • Can sometimes be related to productivity and/or other soil characteristics such as nutrition or pH. • For better or worse is often used to identify zones for sampling.
Other on the go sensors • pH, Organic Matter, • http://www.veristech.com/products/visnirfaq.aspx
Variable Rate N Applications • Important to correct both Spatial and temporal variability • Spatial variability may be dealt with using historic yield maps • Sensors can be used to address spatial and temporal variability • Apply N where and when needed.
Variable Rate N Applications • Historically water quality concerns were addressed by decreasing average annual N rates • If not done properly this can reduce yield • Variable rate N applications may not decrease the average N rate but will decrease residual N because N utilization is improved • AKA efficiency is increases, which decreases potential for off-site transport
Use of Sensor Based N Management in Manured Systems • Sensors have been very much under utilized for manure N management • There is a lot of potential for improving manure N management • Manure N availability is highly variable do to a variety of factors • Manure type and characteristics • Soil type, moisture, and temperature • Application timing and methods • Crop type (winter vs summer)
Nitrogen Management in Manured System • Variability in N availability has spawned a great volume of research devoted to evaluating N mineralization and crop uptake. • Despite this effort producers have difficulty dealing with uncertainty about N availably as well as the distribution of available N in the field
Common Methods to Address Variability • Apply manure at rates that are in excess of crop N need. • Continuous annual application at N based rates • These solutions have generally been halted by P based nutrient management planning • Apply supplemental N sufficient to overcome variability (apply N sufficient to optimize yield on most N deficient area of the manure field
Example of Research on Poultry litter N Availability • Poultry litter was pre-plant applied for corn production on the Eastern Shore of VA.
2002 Litter 56% 2003 Litter 40% N Response Curve • Poultry litter N utilization ranged from 40-56% 160 2002 2003 140 120 Corn Yield (bu acre-1) 100 80 60 40 0 50 100 150 200 250 Inorganic N Fertilizer Rate (lbs acre-1)
In-Field Variability after Manure Applications • Uniform application of manure is difficult to achieve • This will of course cause non uniformity in crop response. • Must be over come by applying based on the need of most deficient areas.
Evaluation of Swine Effluent Application Methods • Study was conducted in Central, KY to evaluate the impact of swine effluent application method on no-till corn yields Aeration Injection Surface Application
Spatial Variability In Crop ResponseResulting from Application Methods Sidedress in 2007 Green seeker was used to measure NDVI and provide row yield estimates Surface Aerway Control Row 7=210 bu/acre Row 8=157 bu/acre Fertilizer Injector
Actual Corn Yields and Estimated Variability • UAN fertilizer provided lowest variability • Injector optimized yield but maximized between row variation • Surface application had less than optimum yield due to ammonia loss and increased variability • Aeration increased drought stress.
Do Manure Applications Impact Sensor Recommendations for Wheat • Comparison of predicted vs actual wheat yields resulting from pre-plant applications of litter and fertilizer showed that litter use did not influence yield prediction on the Eastern Shore, VA
Sensor Based Top-dress N Applications Pre-plant Litter • In 2003 yields were similar, however in 2004 litter produced lower yields due to early season N deficiency • Topdress applications did not overcome early season deficiency
Sensor-based Technology is a Must for Continued Improvement in Manure N Management • Simply using an N rich strip can take the guess work out of estimating whole field N availability • Provides potential to correct in-field variability with high precision applications (ie, by plant or by row) • Current methods used to estimate crop N status appear to be sufficient