Download
1 / 63
630 likes | 791 Vues
American Community Survey Accessing 2010 ACS 1-Year Estimates for Hawaii. Jerry Wong Information Services Specialist Los Angeles Regional Office U.S. Census Bureau. 6911. What is the American Community Survey?. A large, continuous survey that:

E N D
American Community Survey Accessing 2010 ACS 1-Year Estimates for Hawaii Jerry Wong Information Services Specialist Los Angeles Regional Office U.S. Census Bureau 6911
What is the American Community Survey? A large, continuous survey that: • is sent to 3 million resident addresses per year • produces characteristics of population and housing • produces estimates for small areas and small population groups • Produces characteristics, not a population count • Key component of the decennial census program
History and Timeline of the ACS N=866,000 housing units in 1,239 counties First operational test conducted in 4 sites First 5-yr estimates release for areas below 20,000 Congress renewed interest in an alternative to the once-a-decade census First 1-yr estimates released for areas 65,000+ N=165,000 housing units 1999 2010 1995 2008 2000 1981 1990 1994 2006 2005 Continuous measurement conceptualized Work began on what evolved into the ACS Test sites expanded yearly to 36 counties in 26 states Group Quarters added First 3-yr estimates released for areas 20,000+ N=3,000,000 housing units in all counties in 50 states, DC & PR
Developing the ACS The ACS was developed to: • Focus the 2010 Census on improving the population count • Provide characteristic data more than once every 10 years to frame policy issues • Allow use of current data to respond to new trends
Social Characteristics Education Marital Status Fertility Grandparent Caregivers Veterans Disability Status • Place of Birth • Citizenship • Year of Entry • Language Spoken at Home • Ancestry / Tribal • Affiliation
Economic Characteristics Income Benefits Employment Status Occupation Industry Commuting to Work Place of Work
Housing Characteristics Tenure (own vs. rent) Occupancy & Structure Housing Value Taxes & Insurance Utilities Mortgage/Monthly Rent
Demographic Characteristics Sex Age Race Hispanic Origin
Recent Content Changes • New Content 2008 • Health Insurance Coverage • Veteran’s Service-connected Disability • Marital History 2009 • Field of Undergraduate Degree • Wording and format changes in 2008 to match Census 2010 questions
ACS Sample Design • Sample is accumulated over TIME to produce lowest levels of geographic detail to replace census sample • 5 years of data are required for areas and population groups with less than 20,000 population • Sample cases selected from an updated Master Address File (MAF)
Sample • Questionnaires mailed to about 1 in 480 addresses each month throughout the U.S. and Puerto Rico. • 1 in 40 addresses per year (2.5% of the population). • Average of 500-600 addresses per month per congressional district. • Total of 3 million addresses each year, or 250,000 per month. • Inclusion of population in group quarters beginning in 2006.
Target Population • Resident population of the United States and Puerto Rico • Living in housing units and group quarters (group quarters added in 2006) • Current residents at the selected address
Methodology Sample includes about 3 million addresses each year Three modes of data collection mail phone personal visit Data are collected continuously throughout the year
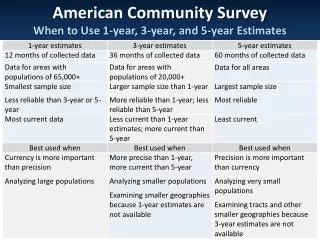
Period Estimates Describe the average characteristics over a specific period of time Contrast with point-in-time estimates -- Do not describe the characteristics on a specific date Period is 1 year, 3 years, or 5 years for ACS 1 Year Estimates Geographic areas with 65,000 or more population 3 Year Estimates Geographic areas with more than 20,000 population 5 Year Estimates All geographic areas down to the census tract & block group level
Geographic Boundaries • Multiyear estimates are based on geographic boundaries as of January 1 of the last year in the multiyear period Example: 2007-2009 ACS estimates use boundaries as of Jan 1, 2009 • Boundary Annexation Survey collects boundary changes • Boundaries of other statistical areas will be updated every decade in conjunction with the decennial census • 2010 Census boundaries will be used for data released in 2011
American Community Survey Geography • The 2010 ACS data release marks the first time ACS will use 2010 tabulation geography for most statistical areas, the same definitions as the 2010 Census. • Geographic areas whose definitions were updated for the 2010 Census include Census Designated Places (CDPs), census tracts, and block groups. • 2010 ACS estimates for PUMAs and urban areas continue to use Census 2000 definitions.
American Community Survey Data Products Profiles Data Profiles Comparison Profiles Selected Population Profiles Tables Detailed Tables Subject Tables Ranking Tables Geographic Comparison Tables
Estimates • ACS data are estimates • ACS data are not counts of the population or housing • Population counts are produced from the decennial census - Counts are updated throughout the decade through the Population Estimates Program
Margin of Error (MOE) • Margin of Error Definition: • A measure of the precision of an estimate at a • given level of confidence (90%, 95%, 99%) • -- MOEs at the 90% confidence level for all • published ACS estimates • Confidence Interval Definition: • A range that is expected to contain the population • value of the characteristic with a known probability
Inflation Adjustment • Dollar-valued data items are inflation adjusted • to the most recent year for the period • Income, rent, home value, and energy costs • Adjusted using inflation factors based on the • Consumer Price Index (CPI) • Adjustment designed to put the data into • dollars with equal purchasing power
Population Controls • Estimates of housing units and people are • controlled to the population estimates derived • from the Population Estimates Program • Multi-year estimates are controlled to the • average of the individual year’s estimates for • the period
Change in Population Controls The 2009 ACS and 2010 ACS 1-year estimates use different Census base years for the population estimates used in the ACS weighting. As a result, users should use caution when making comparisons across years. Specifically, estimates of the number of people in a given location (population size) are not strictly comparable between these two years. In general, the change to more current population estimates is not expected to have a meaningful impact in the percent distributions, rates, or ratios for non-demographic characteristics for many of the largest geographic areas. The Census Bureau is currently researching the effect on these distributions. For more details, visit the ACS Research Note Change in Population Controls.
ACS Data Products are Available Through the American FactFinder (AFF) on www.census.gov
Note: You are on the Main Page and the Your Selections box is empty
Using Quick Start, Enter Honolulu County, Hawaii in the Geography Box, then click GO
Note: As you start typing, a drop down menu appears with possible geography options. You may select one of the options by clicking on it.
You are now on the Search page, Honolulu County is in Your Selections box and all the tables available are listed under the Search Results
To View a Table: • Double Click on the • Link OR • Check the Box next • to the Table and • Click “View” • A few ACS tables • are on this page
…Or use Topics to narrow your Search For ACS go to Program or Data Set
Filtering Tables by TopicProgram – American Community Survey
Before beginning a new search, • Clear all selections from the • Your Selections Box • Click on MAIN to return to • the Main Page
Data ProfilesDisplay a Range of Social, Economic, Housing, and Demographic Data for a Particular Geographic Area
Honolulu County Selected Economic Characteristics Social Profile Economic Profile Housing Profile Demographic Profile Narrative Profile
Honolulu County Selected Housing Characteristics Social Profile Economic Profile Housing Profile Demographic Profile Narrative Profile
Honolulu County Demographic & Housing Estimates Social Profile Economic Profile Housing Profile Demographic Profile Narrative Profile
Comparison ProfilesDisplay Multiple Years Worth of Data & Indicate Where There are Statistically Significant Differences
Comparison ProfilesSelect Geographic Type “Place” to Obtain Data for Honolulu CDP