
MeV Data Analysis Tool Overview
Learn how to work with MeV software for loading and displaying TDMS data. Get insights into options, adjustments, and analyses available, including normalization and statistical tests. Save your results for further analysis.

MeV Data Analysis Tool Overview
E N D
Presentation Transcript
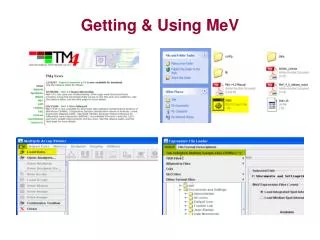
Display & Options Lay of the land: Options across top History on left (expand) Expression image on right Info box, right-click options Display Menu Adjustments: Element size (10x10 or 50x10) Color scale (-2 to +2 or other) Color scheme Gene Row labels depends on what you’ve imported with data; common
Data Set Notes: • Data used in this lab exercise was generated from Affy Mouse chips that were stripped twice. • Each chip was rotated among the three conditions. • Samples: A1, A2, A3, B1, B2, B3, C1, C2, C3 • A, B, C – chip identifier • 1, 2, 3 – uses • ++: wild type (normal) A1, B2, C3 • dd: knockout A2, B3, C1 • hfN: hagfish gene A3, B1, C2
Analysis (of many, many options) • Normalization: Affy data has already been normalized and converted to log2 prior to import • Trim/filter: • Adjust Data/Data Filters/Variance Filter • Statistical tests: SAM and/or ANOVA • Analysis/SAM/Multiclass (3): ++, dd, hfN • Analysis/ANOVA (3): ++, dd, hfN • Hierarchical clustering (HCL) • Pearson Correlation; average linkage