Download
1 / 45
450 likes | 536 Vues
Dive into the EPA's 2000 report to Congress focusing on water quality assessments for aquatic life support, fish consumption, recreational activities, drinking water supply, and agricultural impact. Explore the findings on oxygen balance in various water bodies like rivers, lakes, and estuaries. Gain insights on nutrient loads and pollution threats in rivers and Bay watersheds.

E N D
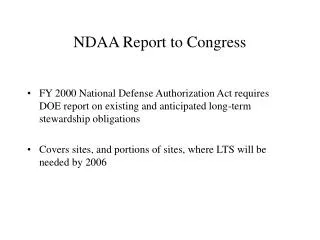
EPA Report to Congress 2000 (latest available on web) Provided to Dr.G. Powell by Dr. D. Monreau, NCSU for this website
Uses for which assessments were made • Aquatic life support • Fish consumption • Primary contact recreation (swimming) • Secondary contact recreation • Drinking water supply • Agricultural
Rivers and Streams
Oxygen Balance in Streams Balance between Supply and Demand
Oxygen Resources of Streams Atmosphere Oxygen Water O2 Conc. Saturation (equilibrium)
86 77 68 59 50 41 32 oF
Biological Oxidation of Organic Matter • Carbohydrate Oxidation: CxHyOz + O2 bacteria CO2 + H2O • Algal cell oxidation: (CH2O)106(NH3)16 H3PO4 + 1.2 O2 bacteria CO2 + H2O Algae = 34.3% C; 7.1% H; 51.8% O; 6.0% N; 0.8% P (15 lb algae/lb N)
Nitrogen Cycle Animal protein Organic N Waste material, death & decay hydrolysis Ammonia NH3 and NH4+ decay Plant protein Organic N Atmospheric N2 nitrogen-fixing bacteria O2 bacteria bacteria lightning Nitrites NO2- bacteria bacteria Nitrates NO3- O2 Anaerobic (O2 absent) Aerobic (O2 present) Hydrolysis is a chemical decomposition process that uses water to split chemical bonds of substances.
1 lb N At 0.0015 lb NH3/day/person (0.00124 lb N/day/person), oxygen demand associated with algal growth = 0.025 lb/day/person Generally exerted in lakes or estuaries where reaeration is low. synthesis 16.7 lb algae respiration 1.2 lb O2/lb algae 20 lb O2/lb N Approximate chemical formula for algal cells: (CH2O)106(NH3)16H3PO4 C= 34.3% H = 7.1% O = 51.8% N = 6.0% P = 0.8%
Load = point +export from land = 21.8 million tons/yr = 5.5 lb/ac/yr
= 0.45 million lbs Load = point + export from land = 2.35 million lbs/yr = 0.59 lb/ac/yr
Chesapeake Bay Watershed New York Pennsylvania Susquehanna Appox. 160 mi. Maryland Delaware West Virginia Potomac District of Columbia James Virginia
Threats to the Bay and Rivers NUTRIENTS SEDIMENTS TOXIC CHEMICALS HABITAT LOSS OVERFISHING
Total = 303 million lbs/yr DHM
Total = 23.8 million lbs/yr DHM
Input to fields Delivery to estuaries Export to streams Decay
Lbs/ac <3.1 3.1-6.3 6.3-12.5 12.5-21.9 >21.9 INPUTS 1 ton/ac = 3.125 lb/ac. Applied Nitrogen Loads From Commercial Fertilizer
Lbs/ac <3.1 3.1-6.3 6.3-12.5 12.5-21.9 >21.9 INPUTS 1 ton/sq.mi. = 3.125 lbs/ac Applied Nitrogen Loads From Animal Manure
Lbs/ac <3.1 3.1-4.1 4.1-5.3 5.3-6.3 >6.3 INPUTS 1 ton/sq.mi. = 3.125 lb/ac Nitrogen Loads From Atmospheric Deposition
March, 2000 water.usgs.gov/nawqa/
Lb/ac 1 kg/ha = 0.89 lb/ac 1 lb/ac = 1.12 kg/ha 10 8 6 4 2
lb/ac 0.9 0.7 0.5 0.3 0.1